Trends
To illustrate trends in data, triangles can be added to the right side of a log using the .add_triangles method. The function can be called repeatedly to add multiple triangles to the log.
Usage
Provide a range of y-values over which to place the triangle, from base to tip
import stratapy as sp
log = sp.load('./examples.sedimentary_log.csv')
log.plot(xmax=8)
log.add_trends([3, 2.3], x=7.5)
Parameters
def add_trends(self, bounds : list, x = None, triangle_type : str = ‘isosceles’, fill_color : str = ‘black’, edge_color : str = ‘black’, linewidth : float = 1.0) -> None:
bounds (list): A pair of y-values defining the base and tip of the triangle, respectively.
x (float, optional): The x-position at which to place the triangle, either a numerical value or a string corresponding to a grain size. Default is None, which attempts to place the triangle at the right edge of the log.
triangle_type (str, optional): The type of triangle to draw. Options are ‘isosceles’ (default) or ‘right’.
fill_color (str, optional): The fill colour of the triangle. Default is ‘black’.
edge_color (str, optional): The edge colour of the triangle. Default is ‘black’.
linewidth (float, optional): The width of the triangle edge. Default is 1.0.
Requirements and Behaviour
Using the xmax parameter of LogObject.plot() in conjunction with the x parameter of add_trends() is recommended to control placement of a trend between a log and the features column.
The y-values provided in the bounds list should be within the range of the log’s y-axis for the triangle to be visible.
Examples
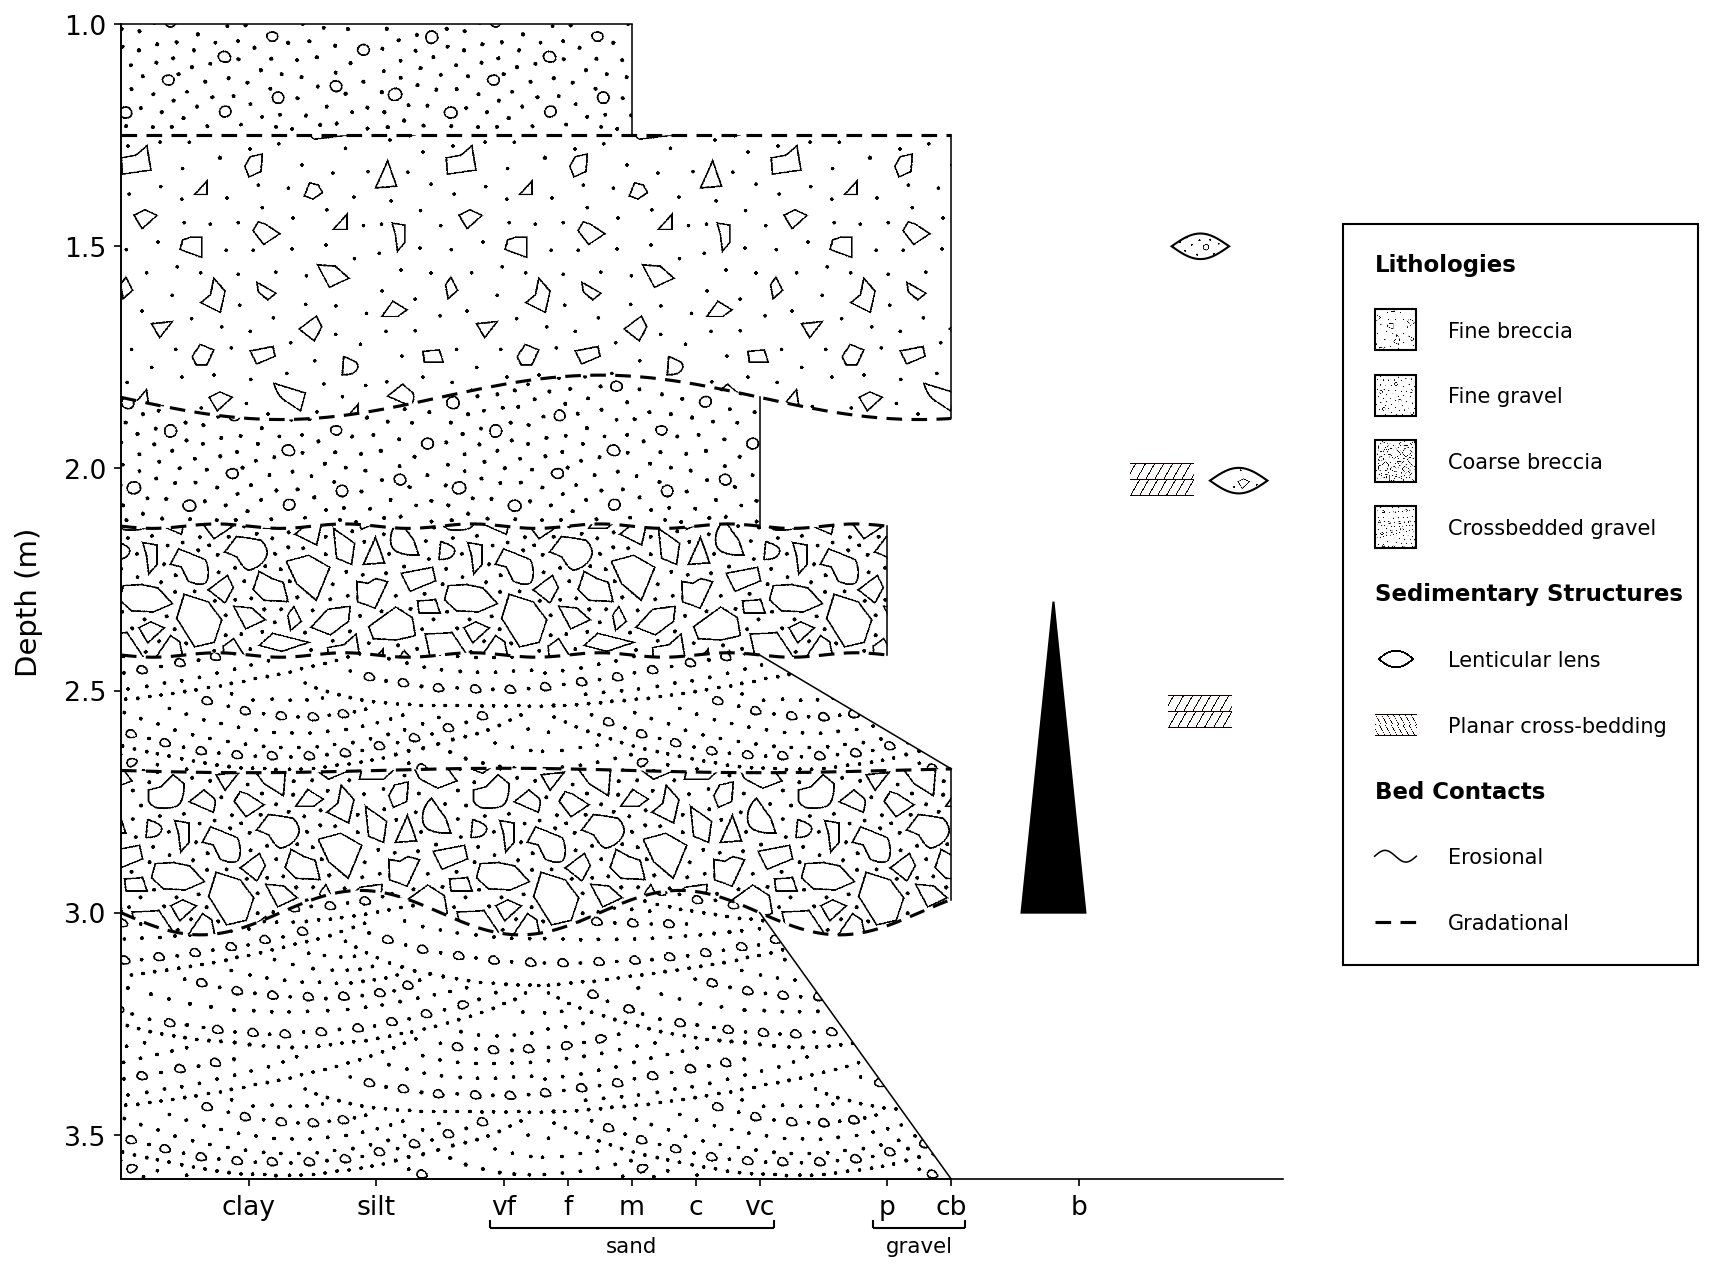
These two examples show how the x and xmax parameters can be used to control the placement of a trend. Increasing xmax creates more space between the log and the features column.
log = sp.load('./examples.sedimentary_log.csv')
log.plot(xmax=7.5)
log.add_trends([3, 2.3], x=7.3)
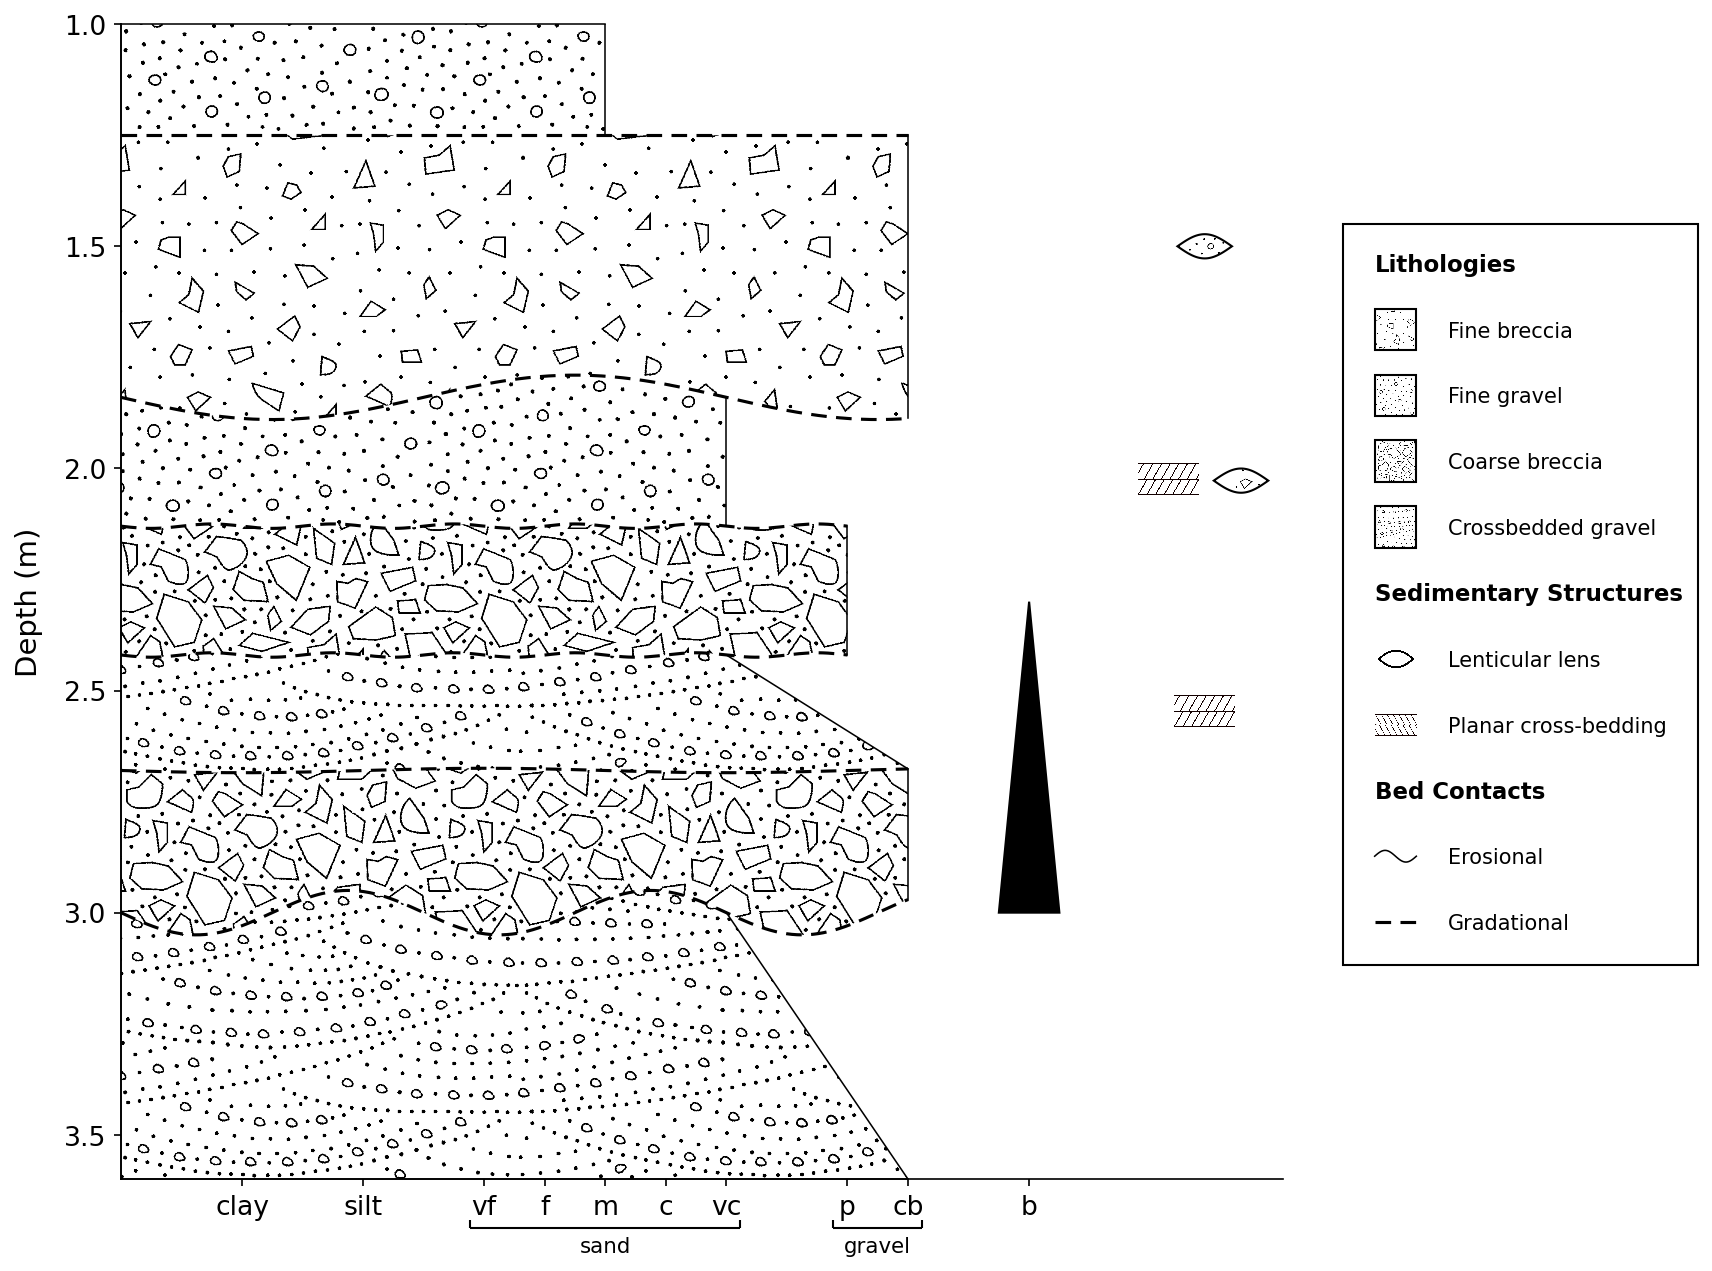
These two examples show how the x and xmax parameters can be used to control the placement of a trend. Increasing xmax creates more space between the log and the features column.
log = sp.load('./examples.sedimentary_log.csv')
log.plot(xmax=8)
log.add_trends([3, 2.3], x=7.5)
See Also
API Reference for
stratapy.core.LogObject.add_trends()