Chronostratigraphy
stratapy provides a convenient way to add a chronostratigraphic timescale alongside your stratigraphic log using the add_chronostratigraphy method of an already plotted log, allowing you to visually correlate your data with the official geological timescale.
Usage
After you have created and plotted a log, simply call the add_chronostratigraphy method on your LogObject instance:
import stratapy as sp
log = sp.load('my_log.csv')
log.plot()
log.add_chronostratigraphy()
This will add a chronostratigraphic axis to the left of a log, determining the relevant time period to display, and showing the six main ranks (Super-eonothem, Eonothem, Erathem, System, Series, Stage) by default.
Tip
The y_axis_unit parameter of LogObject.plot() will be used to infer the time period from the input file over which to plot chronostratigraphy, so should be set appropriately.
Parameters
ranks_to_display (list, optional): A list of integer rank indices to display. Default is
[0, 1, 2, 3, 4, 5], which shows all main ranks from Super-eonothem (0) to Stage (5). Must be a contiguous subset.width_ratio (float, optional): The width ratio between the chronostratigraphy axis and the main log axis. Default is 0.2.
spacing (float, optional): Spacing between the chronostratigraphy axis and the main log axis, as a fraction of the average axis size. Default is 0.1.
Requirements and Behaviour
This method only works if the y-axis of your log is set to ‘age’. If your log uses depth or height, you will receive a warning and no chronostratigraphy will be added.
The chronostratigraphy axis is automatically aligned with your log’s age range and units.
The axis is added to the left of your existing log, and the y-axis labels/ticks are moved accordingly.
Note
To add chronostratigraphy to a non-age-based log or to add it to a more complex figure, the stratapy.core.chronostratigraphy() function can plot standalone chronostratigraphy, offering more control and flexibility, such as horizontal orientation and custom age ranges.
Examples
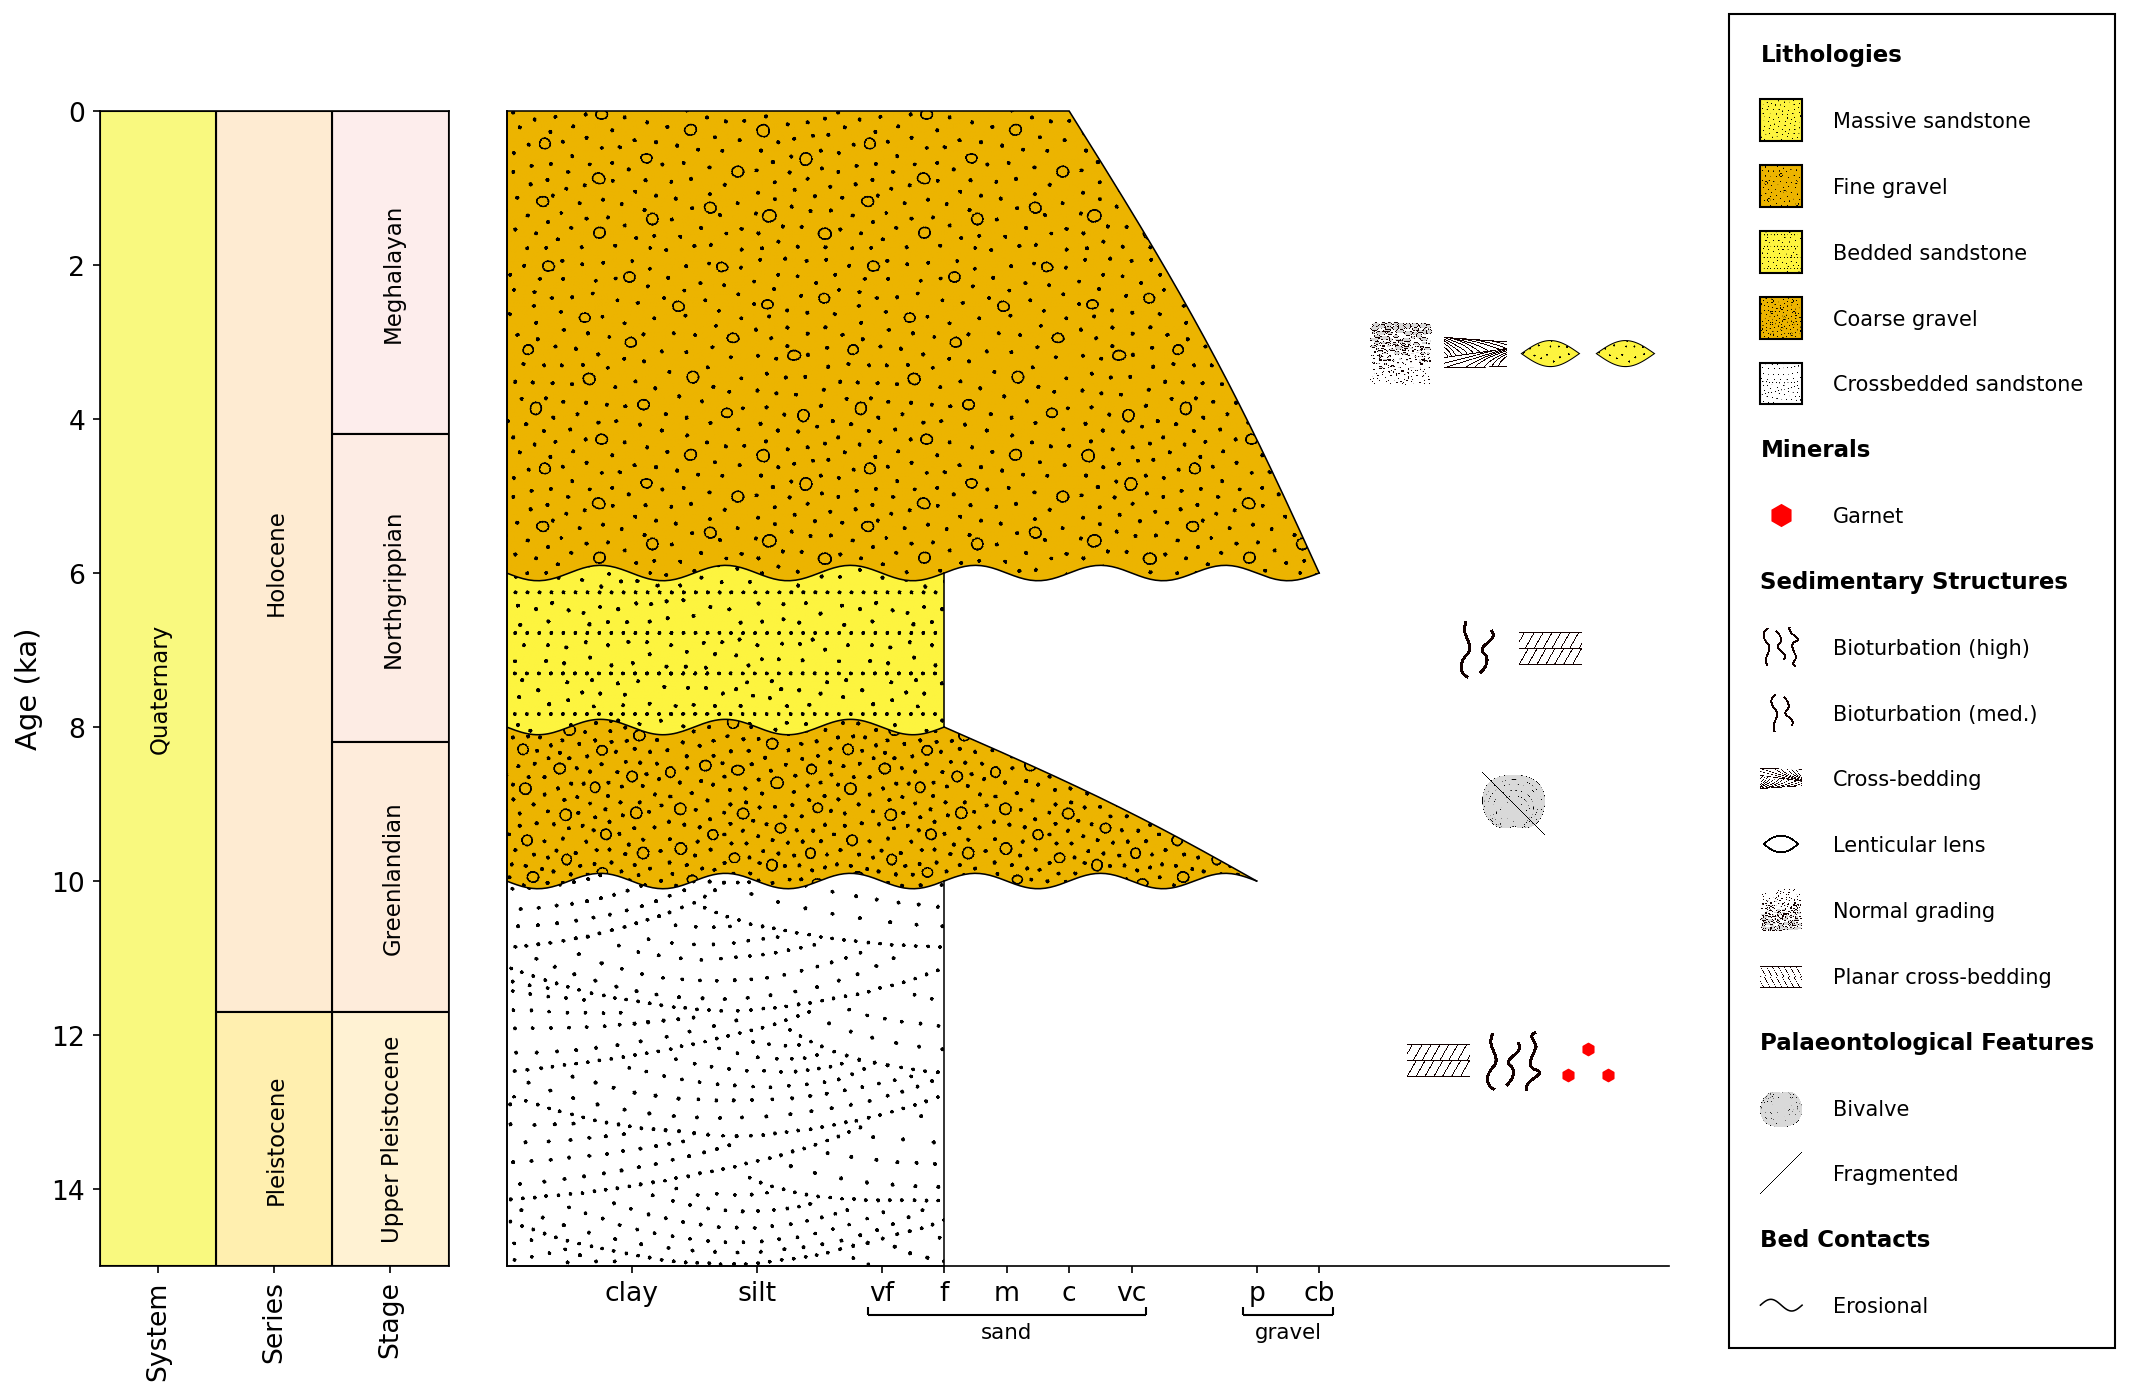
# Load an example log which has an age axis in Ka
log = sp.load('examples.age_based_log_Ka.csv')
# Plot the log, specifying the age units
log.plot(y_axis_unit='Ka')
# Add chronostratigraphy to show system, series, and stage
log.add_chronostratigraphy(ranks_to_display=[3, 4, 5], width_ratio=0.3, spacing=0.05)
See Also
API Reference for
stratapy.core.LogObject.add_chronostratigraphy()API Reference for
stratapy.core.chronostratigraphy()