Figure Layout
This page describes how to control the appearance and layout of figures in stratapy, including figure resolution, sizing, borders, transparency, fonts, and font size. These options help you create publication-quality stratigraphic plots tailored to your needs.
Figure Resolution
dpi (dots per inch):
Controls the resolution of the entire figure. Higher values produce sharper images but increase file size and rendering time.
Set using the dpi parameter in plotting functions (e.g., plot(dpi=300)).
Typical values: 100 (draft), 150 (default), 300–600 (publication).
ppi (pixels per inch):
Controls the resolution of image-based lithological patterns within units.
Set using the ppi parameter (e.g., plot(ppi=400)).
Higher values make patterns appear more detailed and less pixelated.
Figure Sizing
figsize:
Sets the size of the figure in inches as a tuple (width, height).
Example: plot(figsize=(10, 8))
Larger figures are better for detailed plots or when using large fonts.
Automatic sizing:
If not specified, stratapy chooses a sensible default based on the number of logs and display mode.
Borders and Spines
unit_borders:
If True, draws borders around each stratigraphic unit.
Example: plot(unit_borders=True)
spines:
Controls the visibility of the axis spines (the lines around the plot area).
Example: plot(spines=False) to hide spines for a cleaner look.
Transparency
Figure background:
To create a transparent background when saving, use:
log.save(‘figure.png’, transparent=True) (if supported by your version).
Fonts and Font Size
Font family:
stratapy uses the default Matplotlib font unless otherwise specified. To change, use matplotlib’s rcParams before plotting:
import matplotlib.pyplot as plt
plt.rcParams['font.family'] = 'Arial'
Font size:
stratapy has an easy way to set font sizes for all types of text elements. Before plotting, you can set fonts using:
import stratapy as sp
sp.formatting.fontsizes['x_axis_label'] = 14
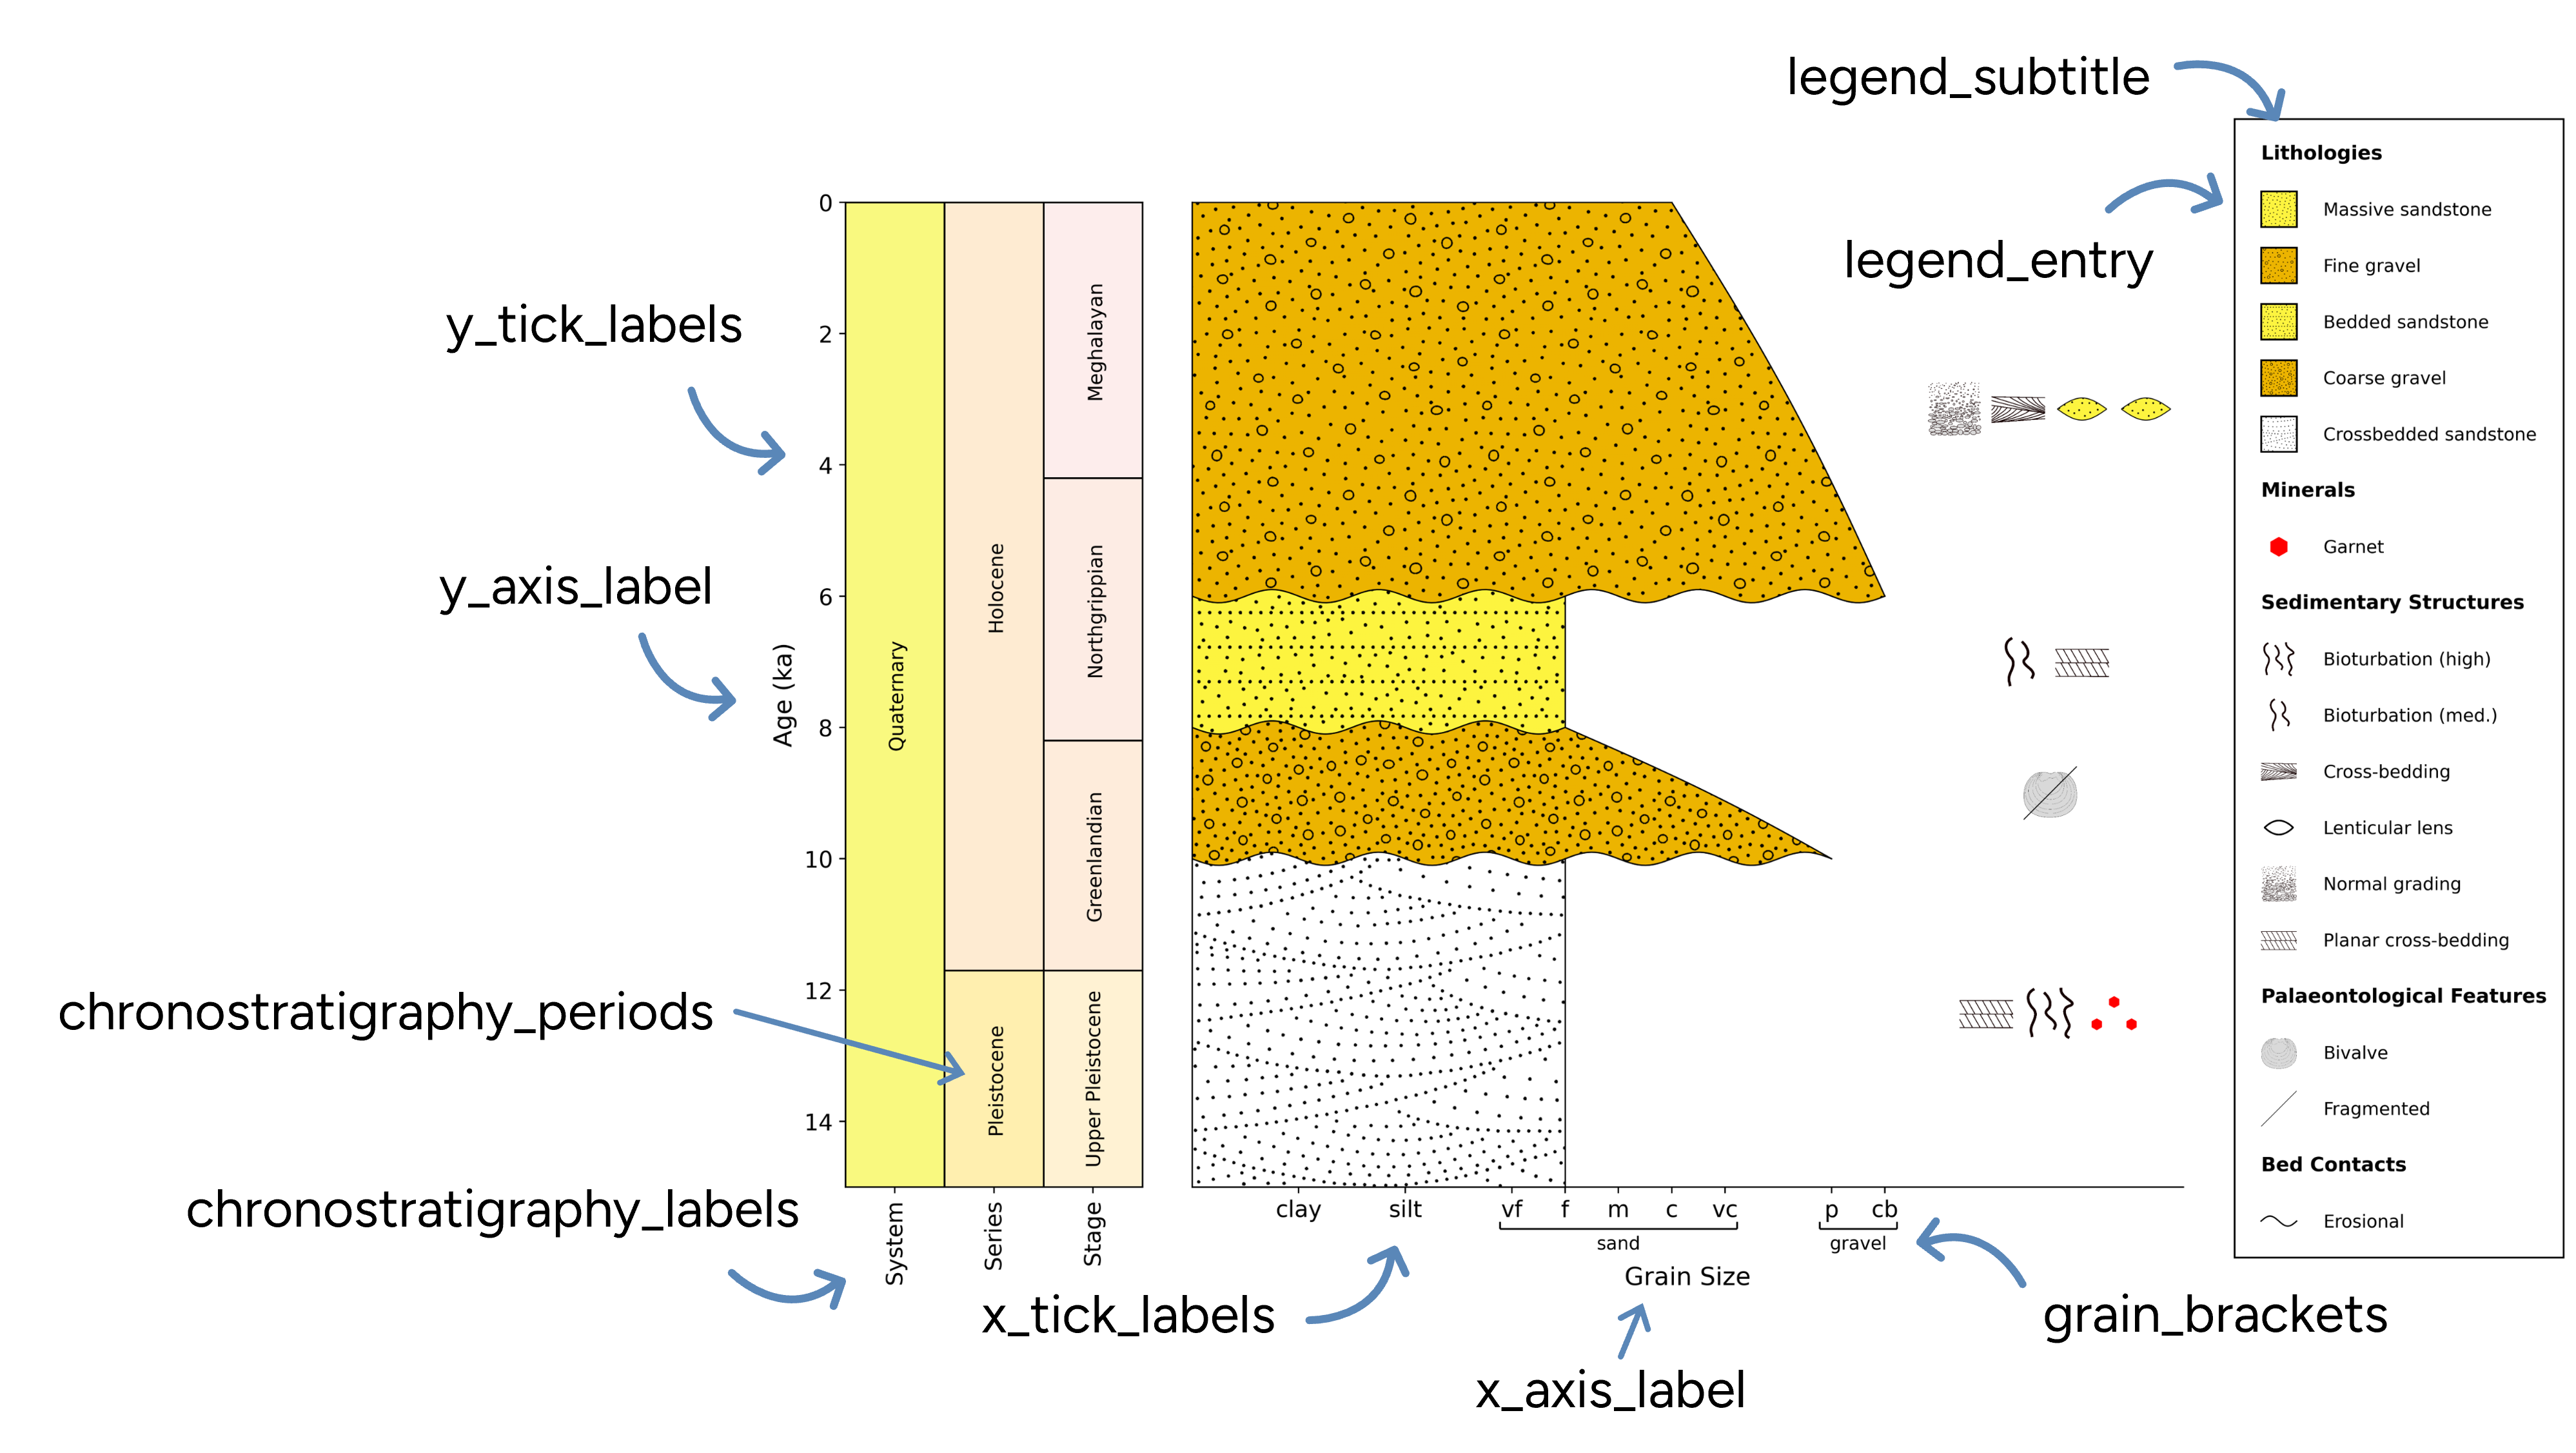
Alternatively, you can use a dictionary to set multiple sizes at once; all of the available keys and their default values are shown in the dictionary and figure below:
sp.formatting.set_fontsizes({
    'x_axis_label': 14,
    'y_axis_label': 14,
    'x_tick_labels': 12.8,
    'y_tick_labels': 12.8,
    'grain_brackets': 12.8*.8,
    'legend_entry': 10,
    'legend_subtitle': 11,
    'chronostratigraphy_periods': 11,
    'chronostratigraphy_labels': 12.8,
})
Notes on Saving Figures
Advanced notes on saving figures in different formats.
The log.save() functionality described in the Tutorial section and used throughout the documentation relies on Matplotlib’s savefig() method. You can provide any file format in the filename and Matplotlib will attempt to save in that format. Some formats may not be supported depending on your Matplotlib installation and backend.
You can check the supported file types available on your device or environment by running the following code:
import matplotlib.pyplot as plt
print(plt.gcf().canvas.get_supported_filetypes())
Common formats include PNG, PDF, SVG, and EPS. Missing formats may require additional libraries or using a different Matplotlib backend.
Custom subplot and figure arrangements can be saved manually using Matplotlib’s savefig() function: matplotlib.pyplot.savefig.