Text Labels
To add text next to units within a log, add_labels can be used to facilitate this.
Usage
Provide a list of strings which match the number of units in your log, and these will be added as labels next to the units on the y-axis. For example:
import stratapy as sp
log = sp.load('examples.age_based_log_Ka.csv')
log.plot()
log.add_labels(
    labels = ["a","b","c","d"],
)
Parameters
labels (list): A list of strings to be added as labels next to the units on the y-axis. The number of strings must match the number of units in your log.
fontsize (float, optional): The font size of the labels. Default is 12.
padding (float, optional): The padding between the labels and the y-axis, in points. Default is 5.
Requirements and Behaviour
The number of labels provided must match the number of units in the log. If there is a mismatch, a warning will be issued and no labels will be added.
Examples
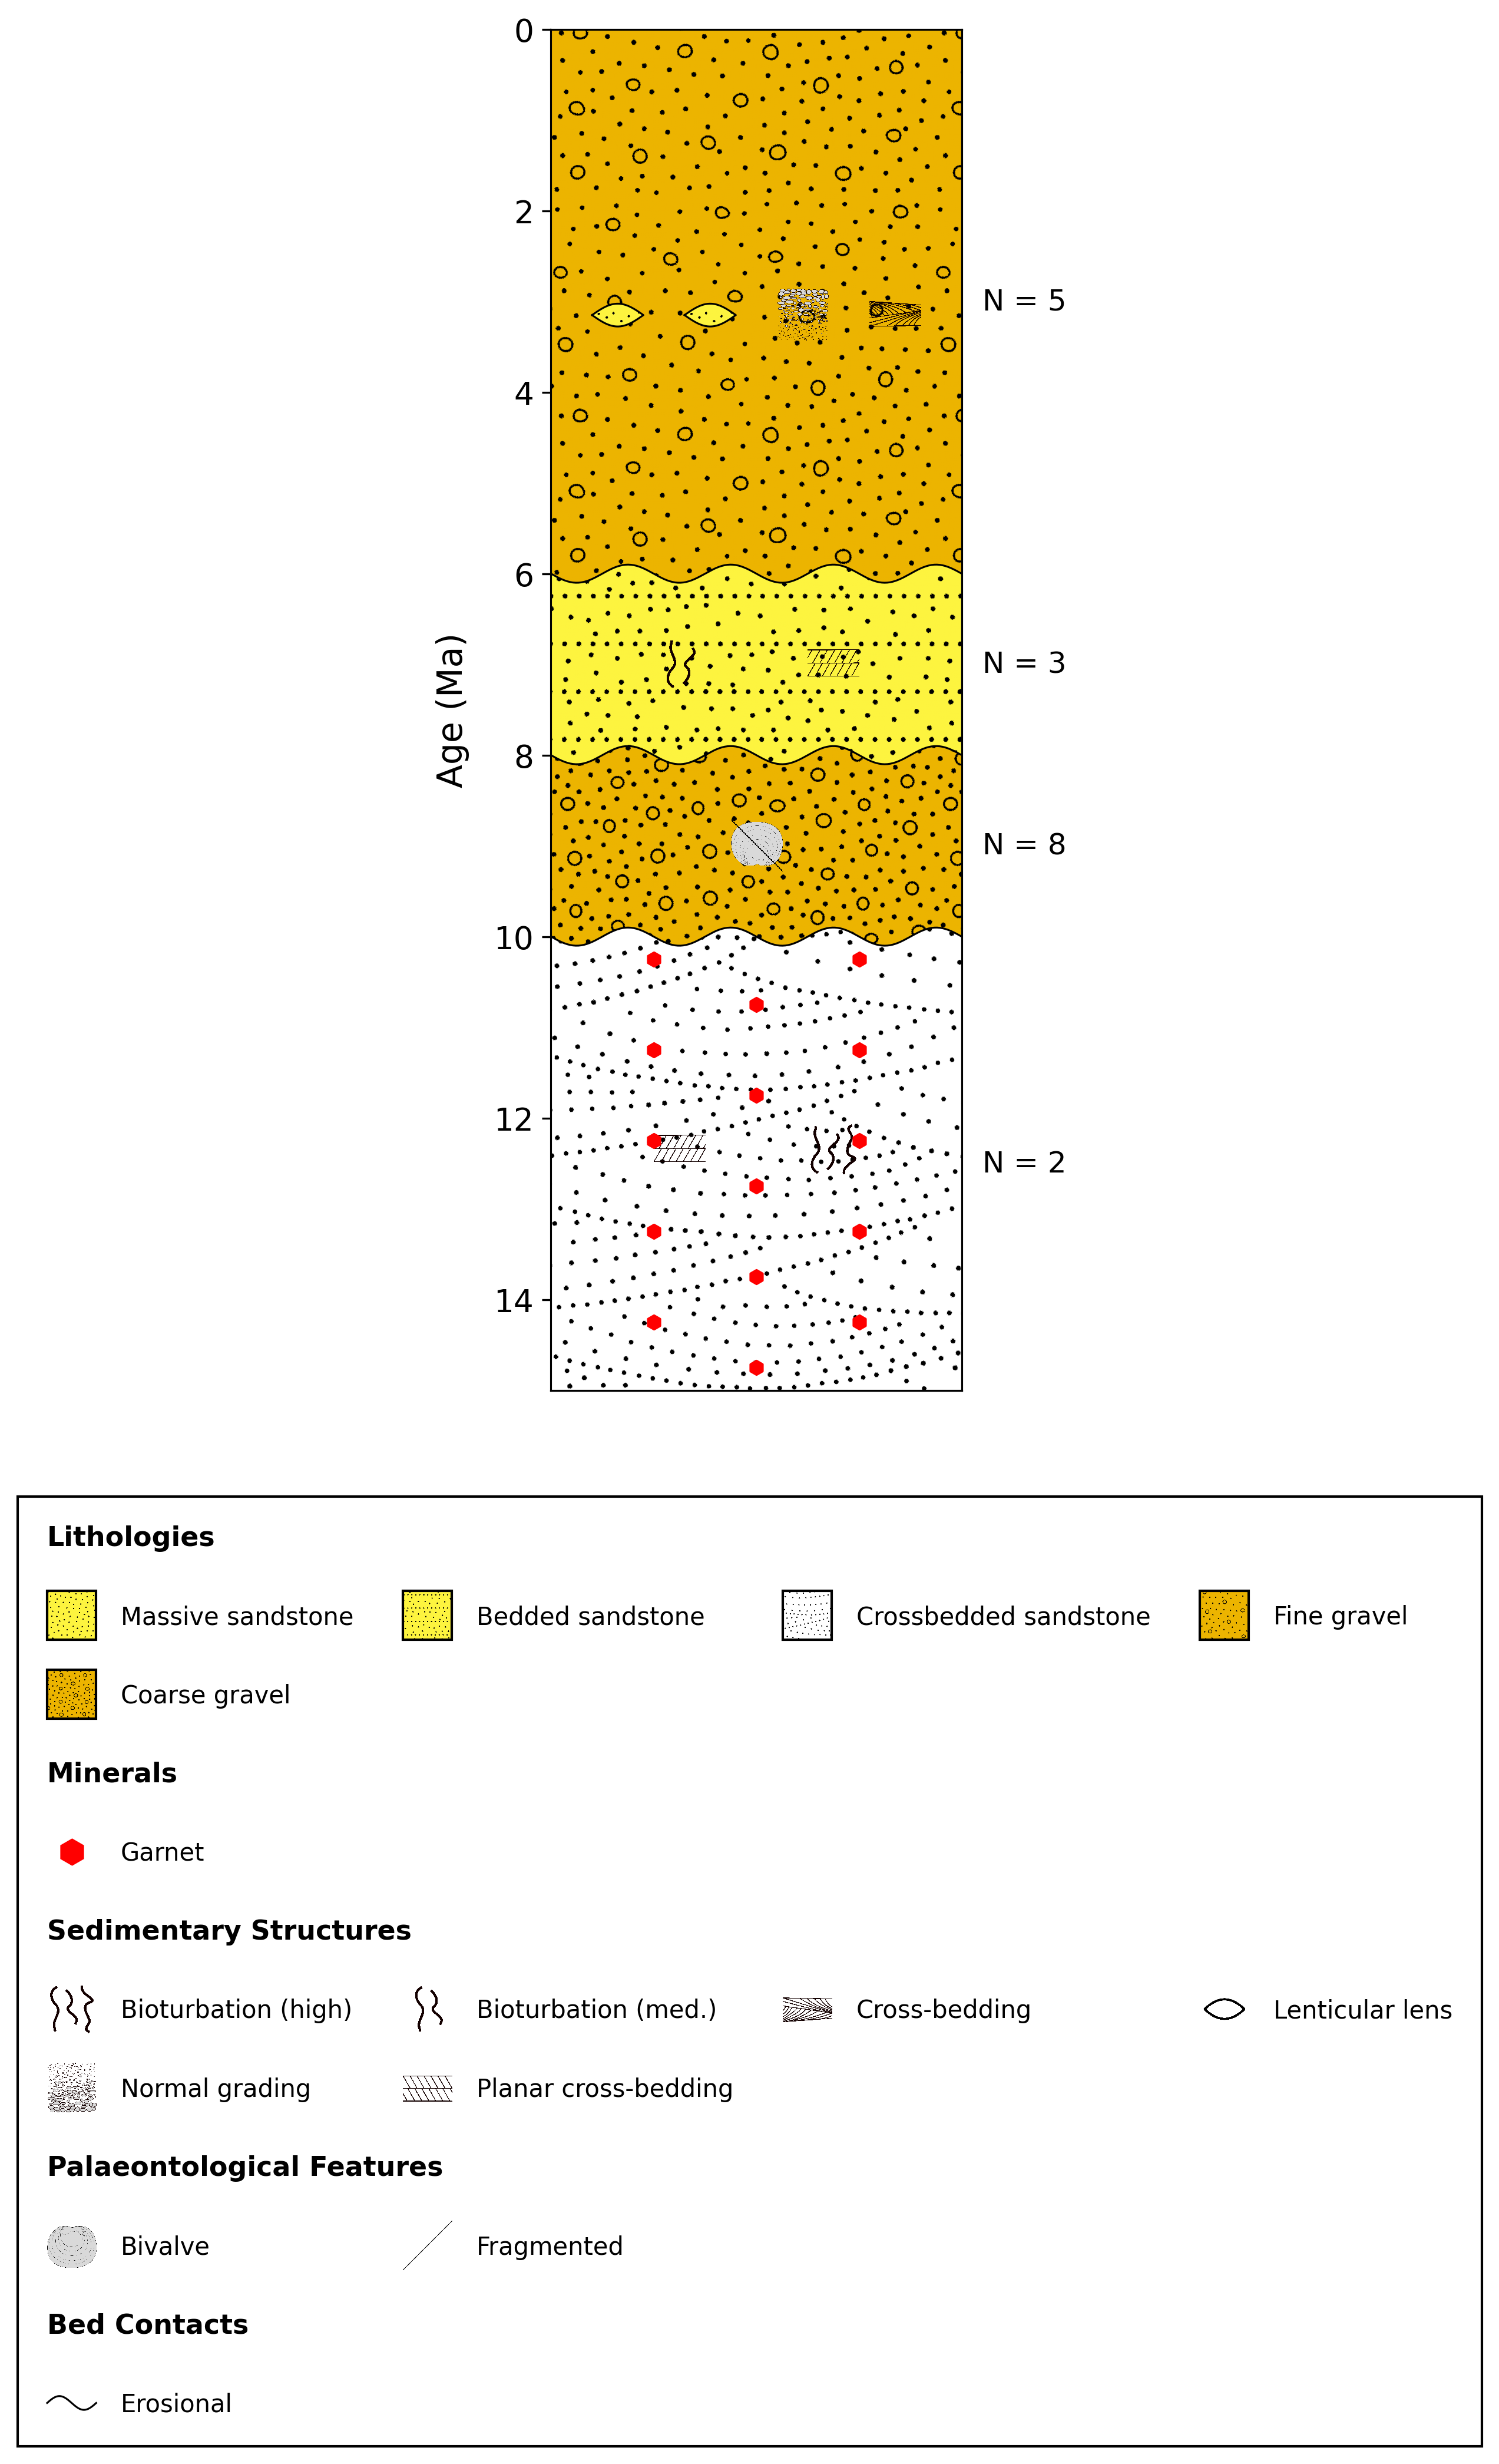
# Load a log
log = sp.load('examples.age_based_log_Ka.csv')
# Plot the log
log.plot(figsize=(6, 10), dpi=300, display_mode='log')
# Add labels, in this case for the number of OSL samples taken in each unit
log.add_labels(["N = 5", "N = 3", "N = 8", "N = 2"])
See Also
API Reference for
stratapy.core.LogObject.add_labels()