Gallery
Note
The gallery is currently a work in progress, we expect to add a significant number of new examples soon.
This page presents a comprehensive gallery of example figures produced with stratapy. Click on any figure to access the corresponding example page, which includes the code and data to reproduce the figure.
Tip
Use Ctrl + F to search for specific keywords within the gallery.
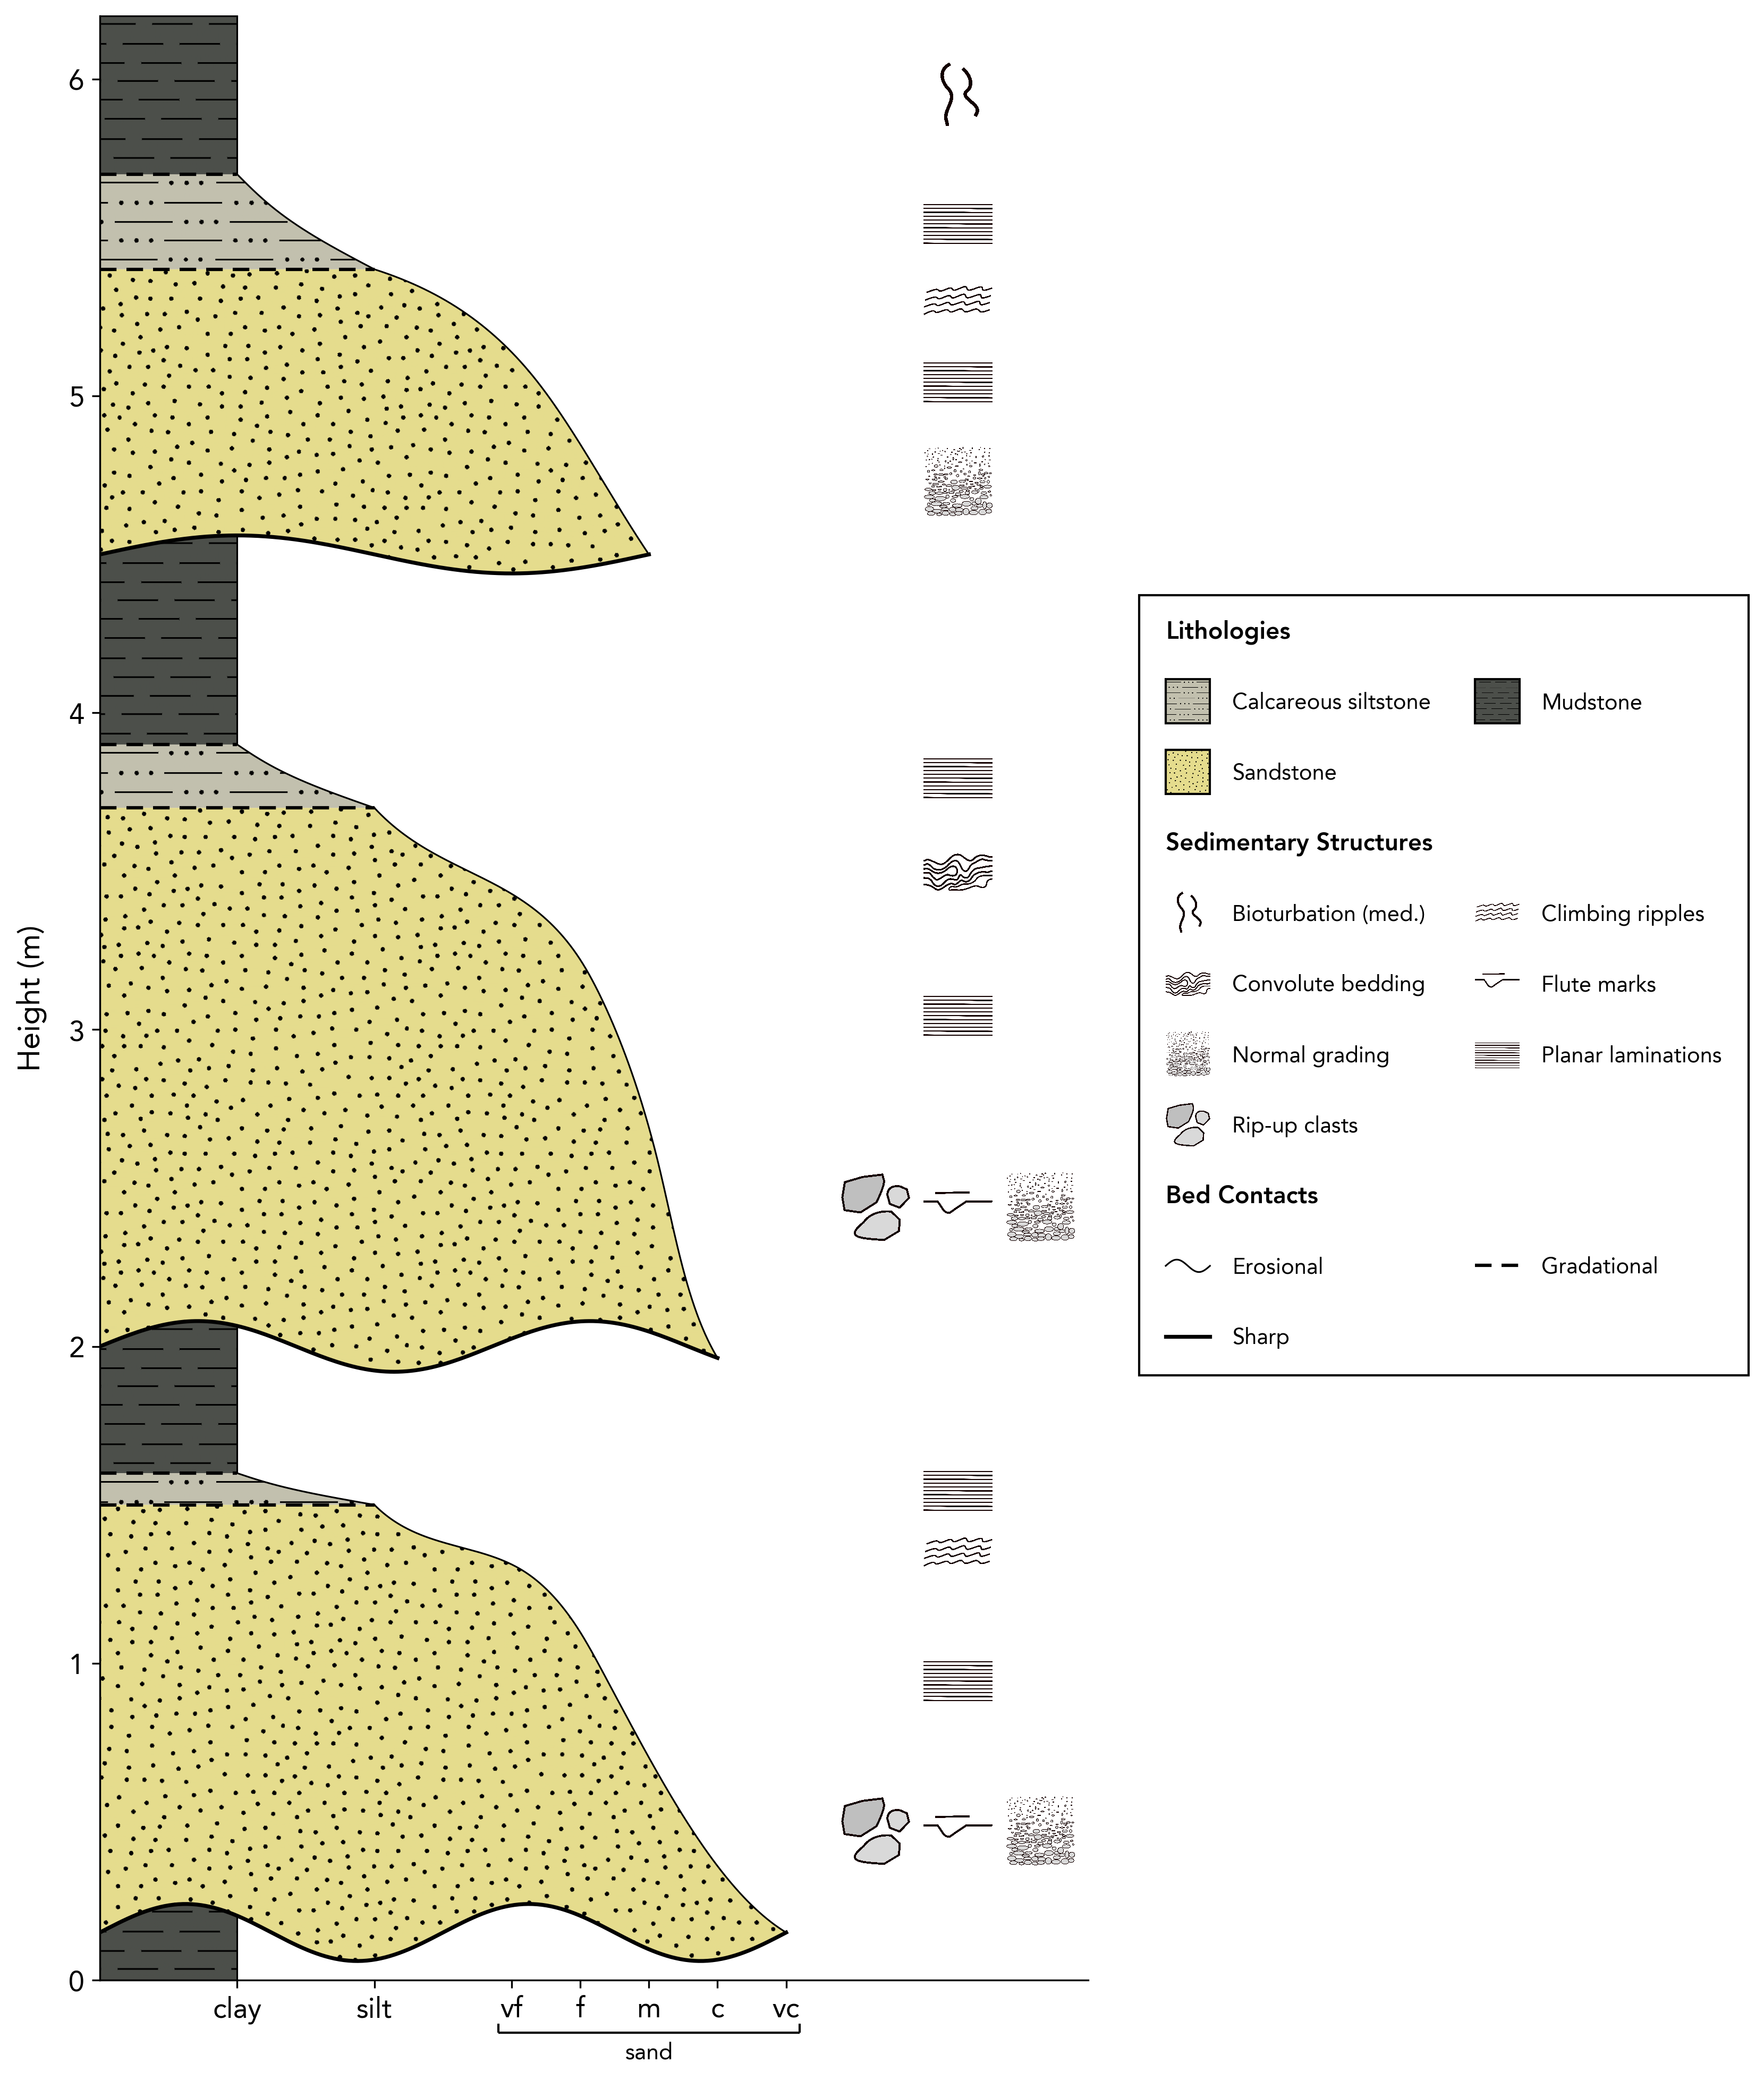
Bouma Sequence Log
A simple log showing the Bouma sequence with some minimal customisation.
Keywords: custom lithologies, sedimentary log, Bouma sequence, turbidity currents
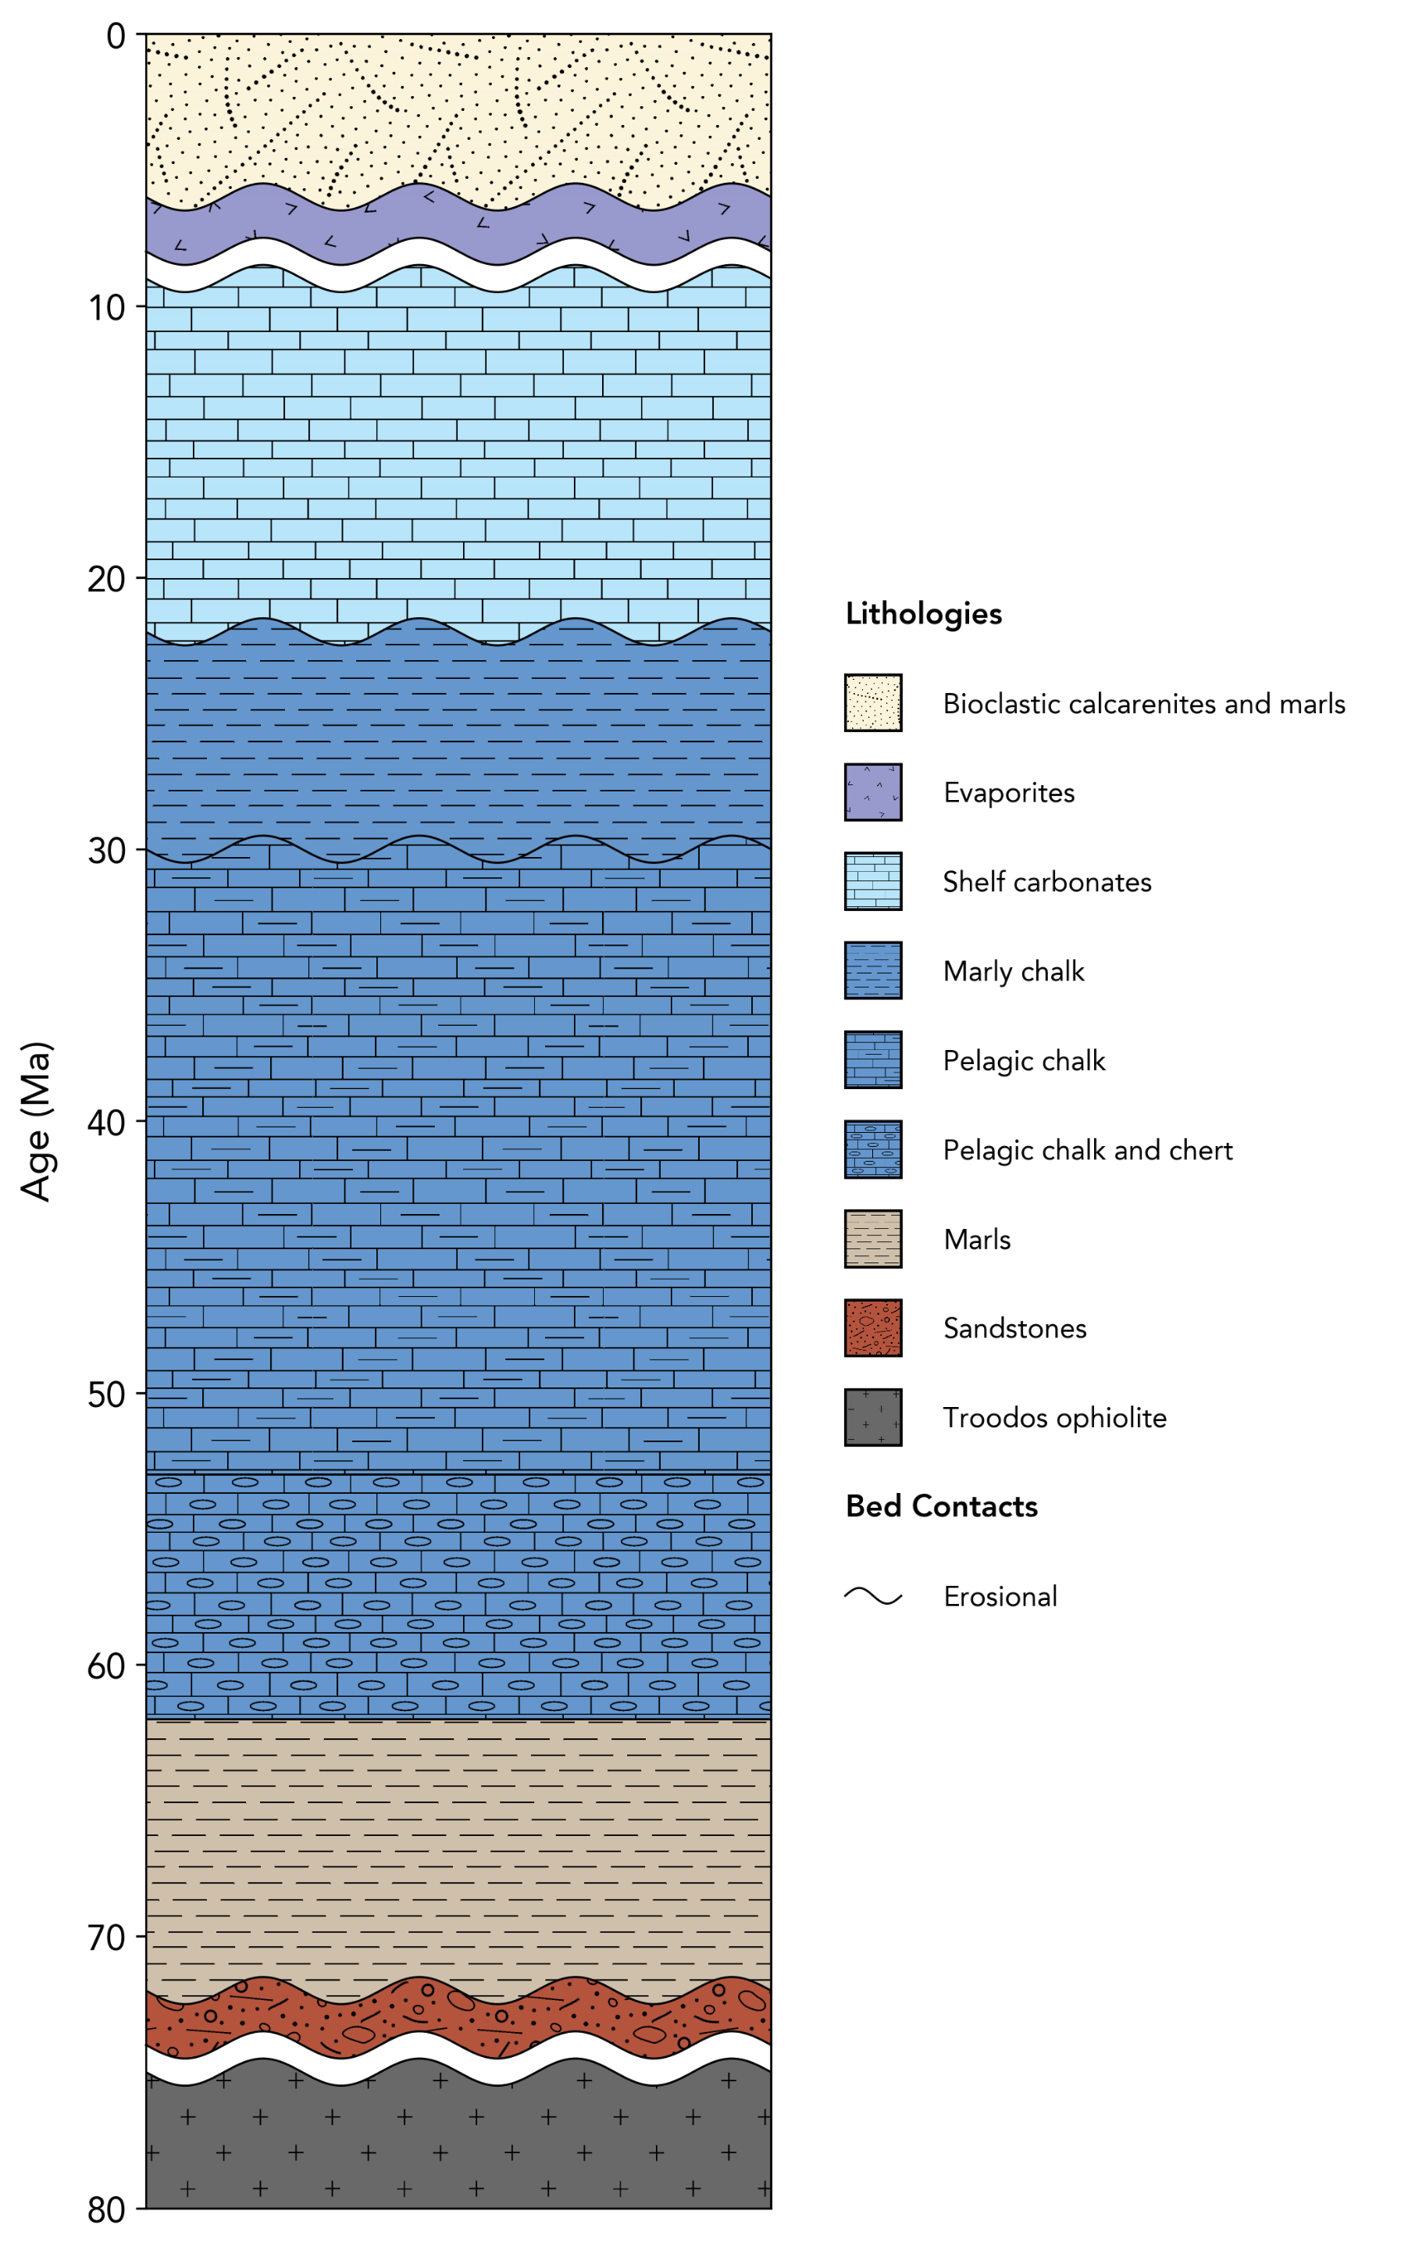
Customised Log of Cyprus
A log showing the depositional history of Cyprus, with customised lithological patterns, colours, and names.
Keywords: custom lithologies, Cyprus, depositional history, sedimentary log
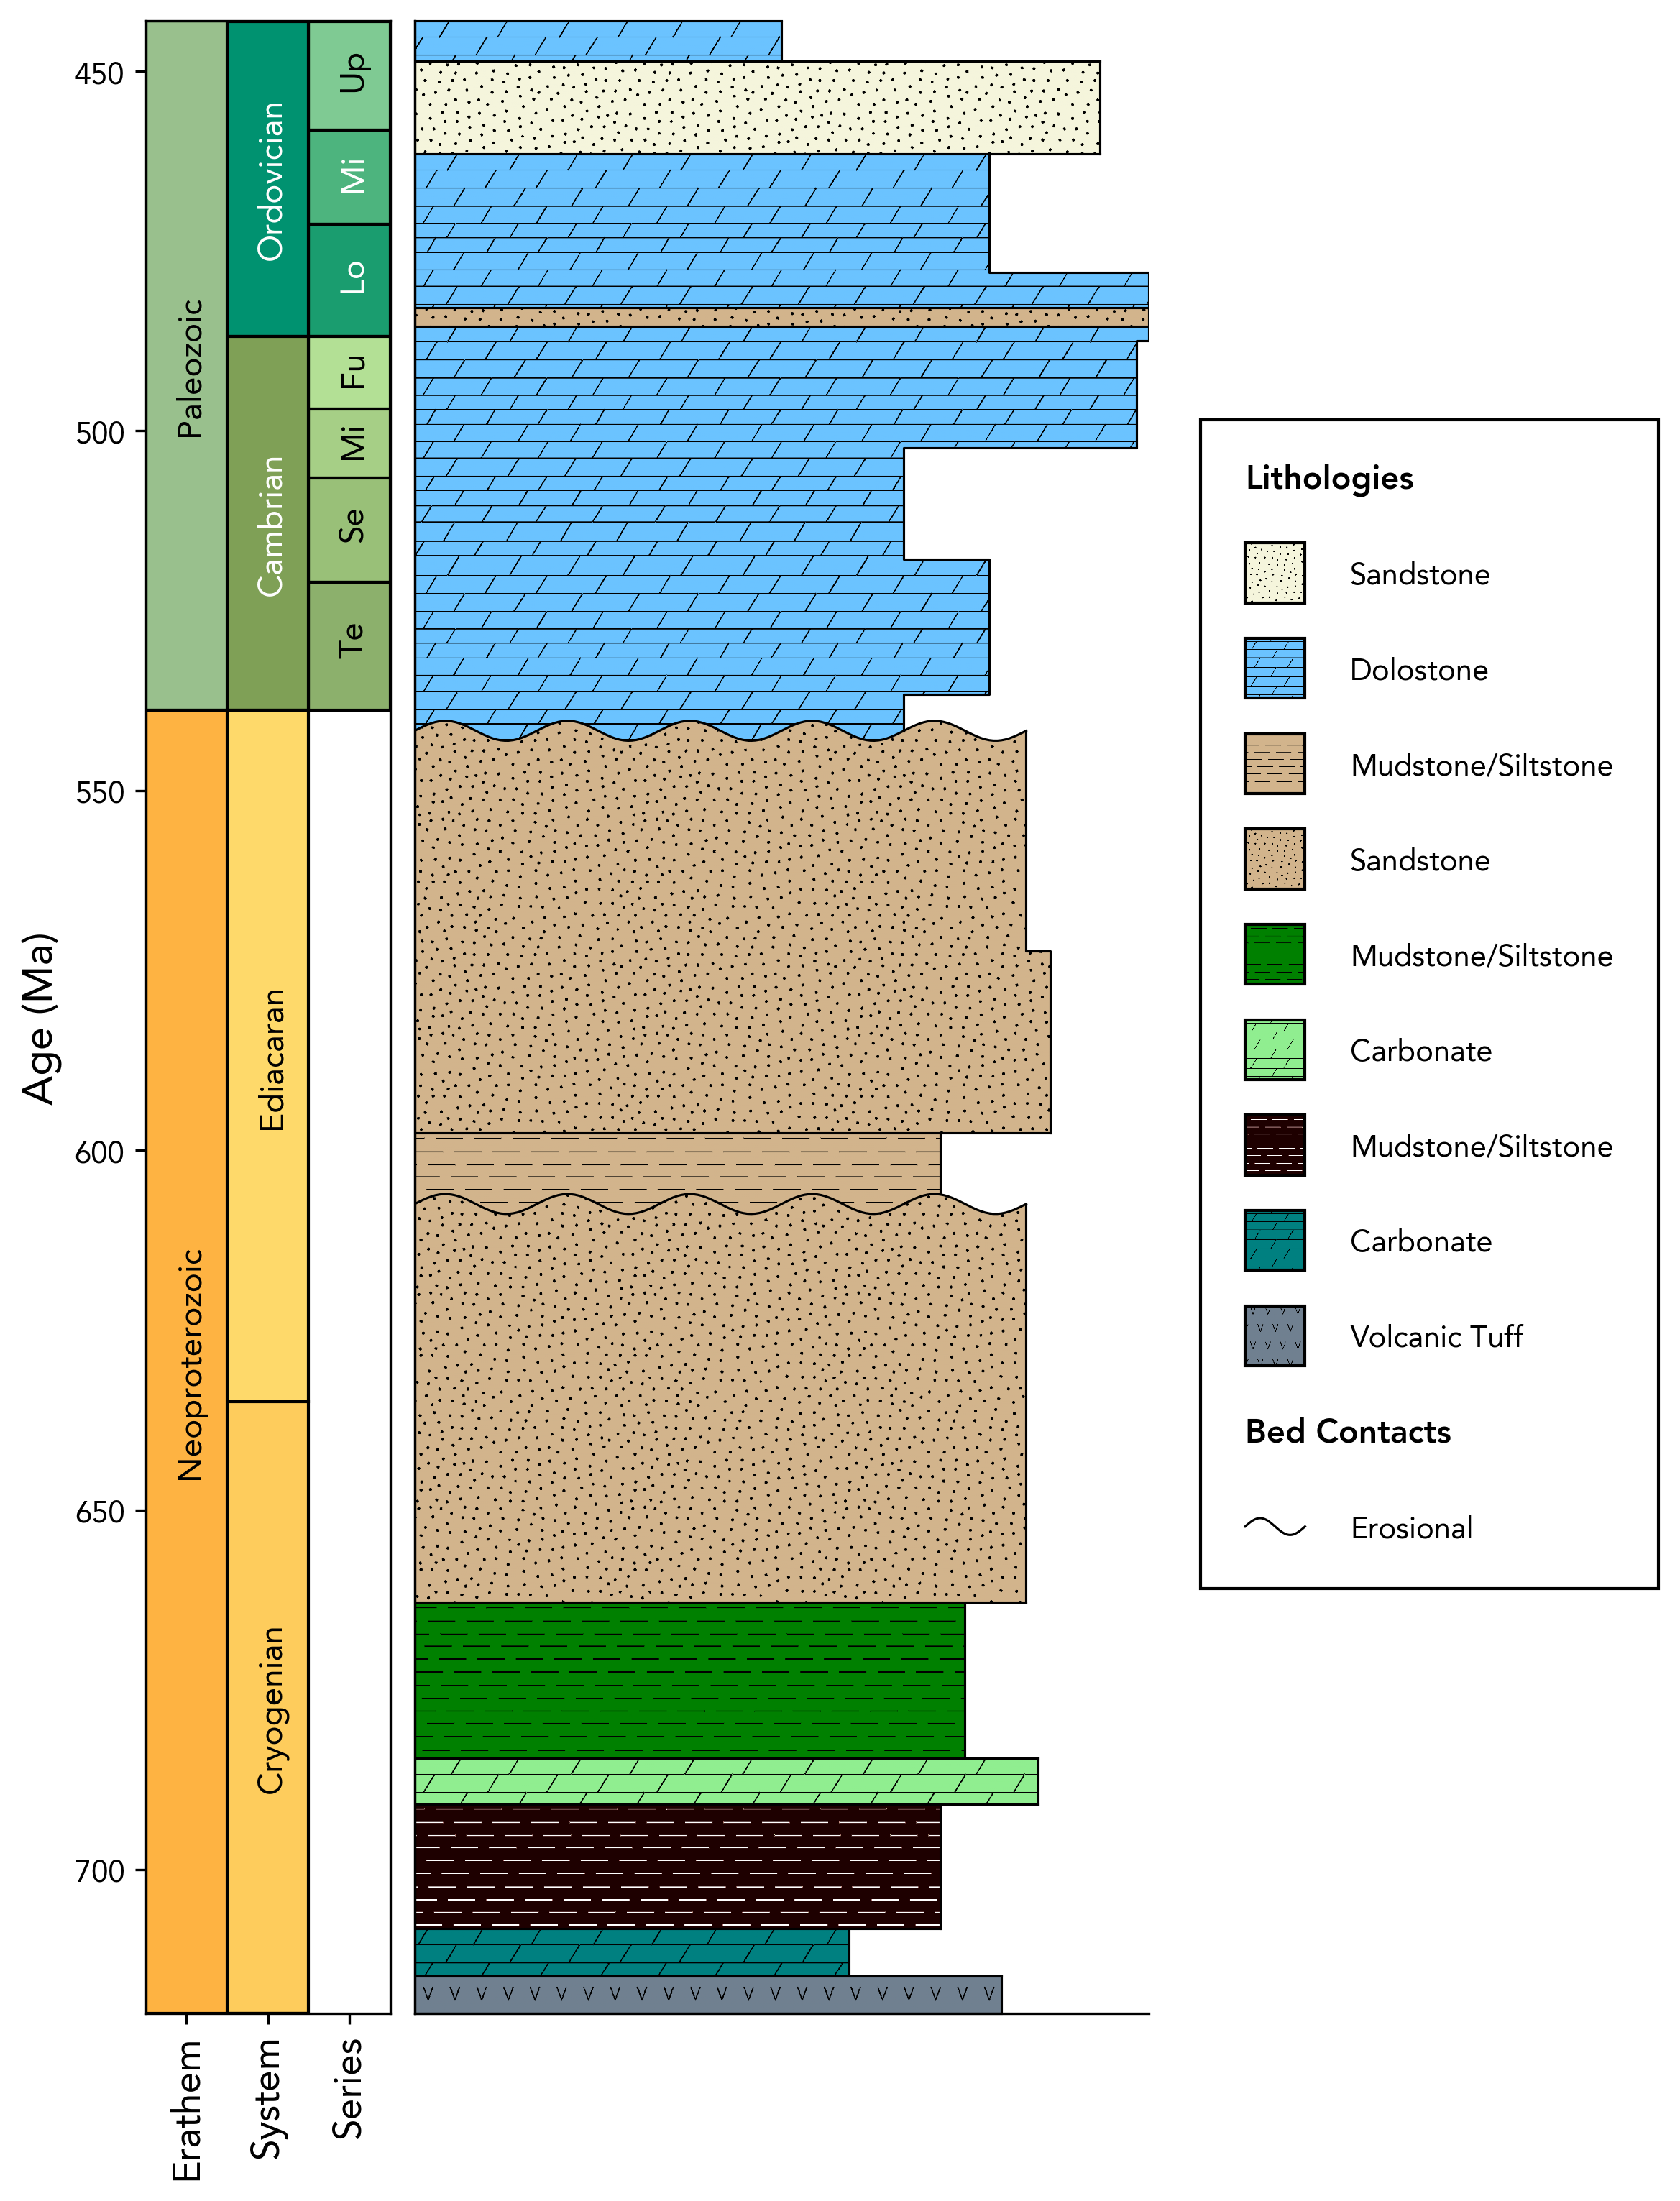
Log with Chronostratigraphy
A log showing the Neoproterozoic to Ordovician stratigraphy of southeastern Idaho with accompanying chronostratigraphy.
Keywords: custom lithologies, Cyprus, depositional history, sedimentary log
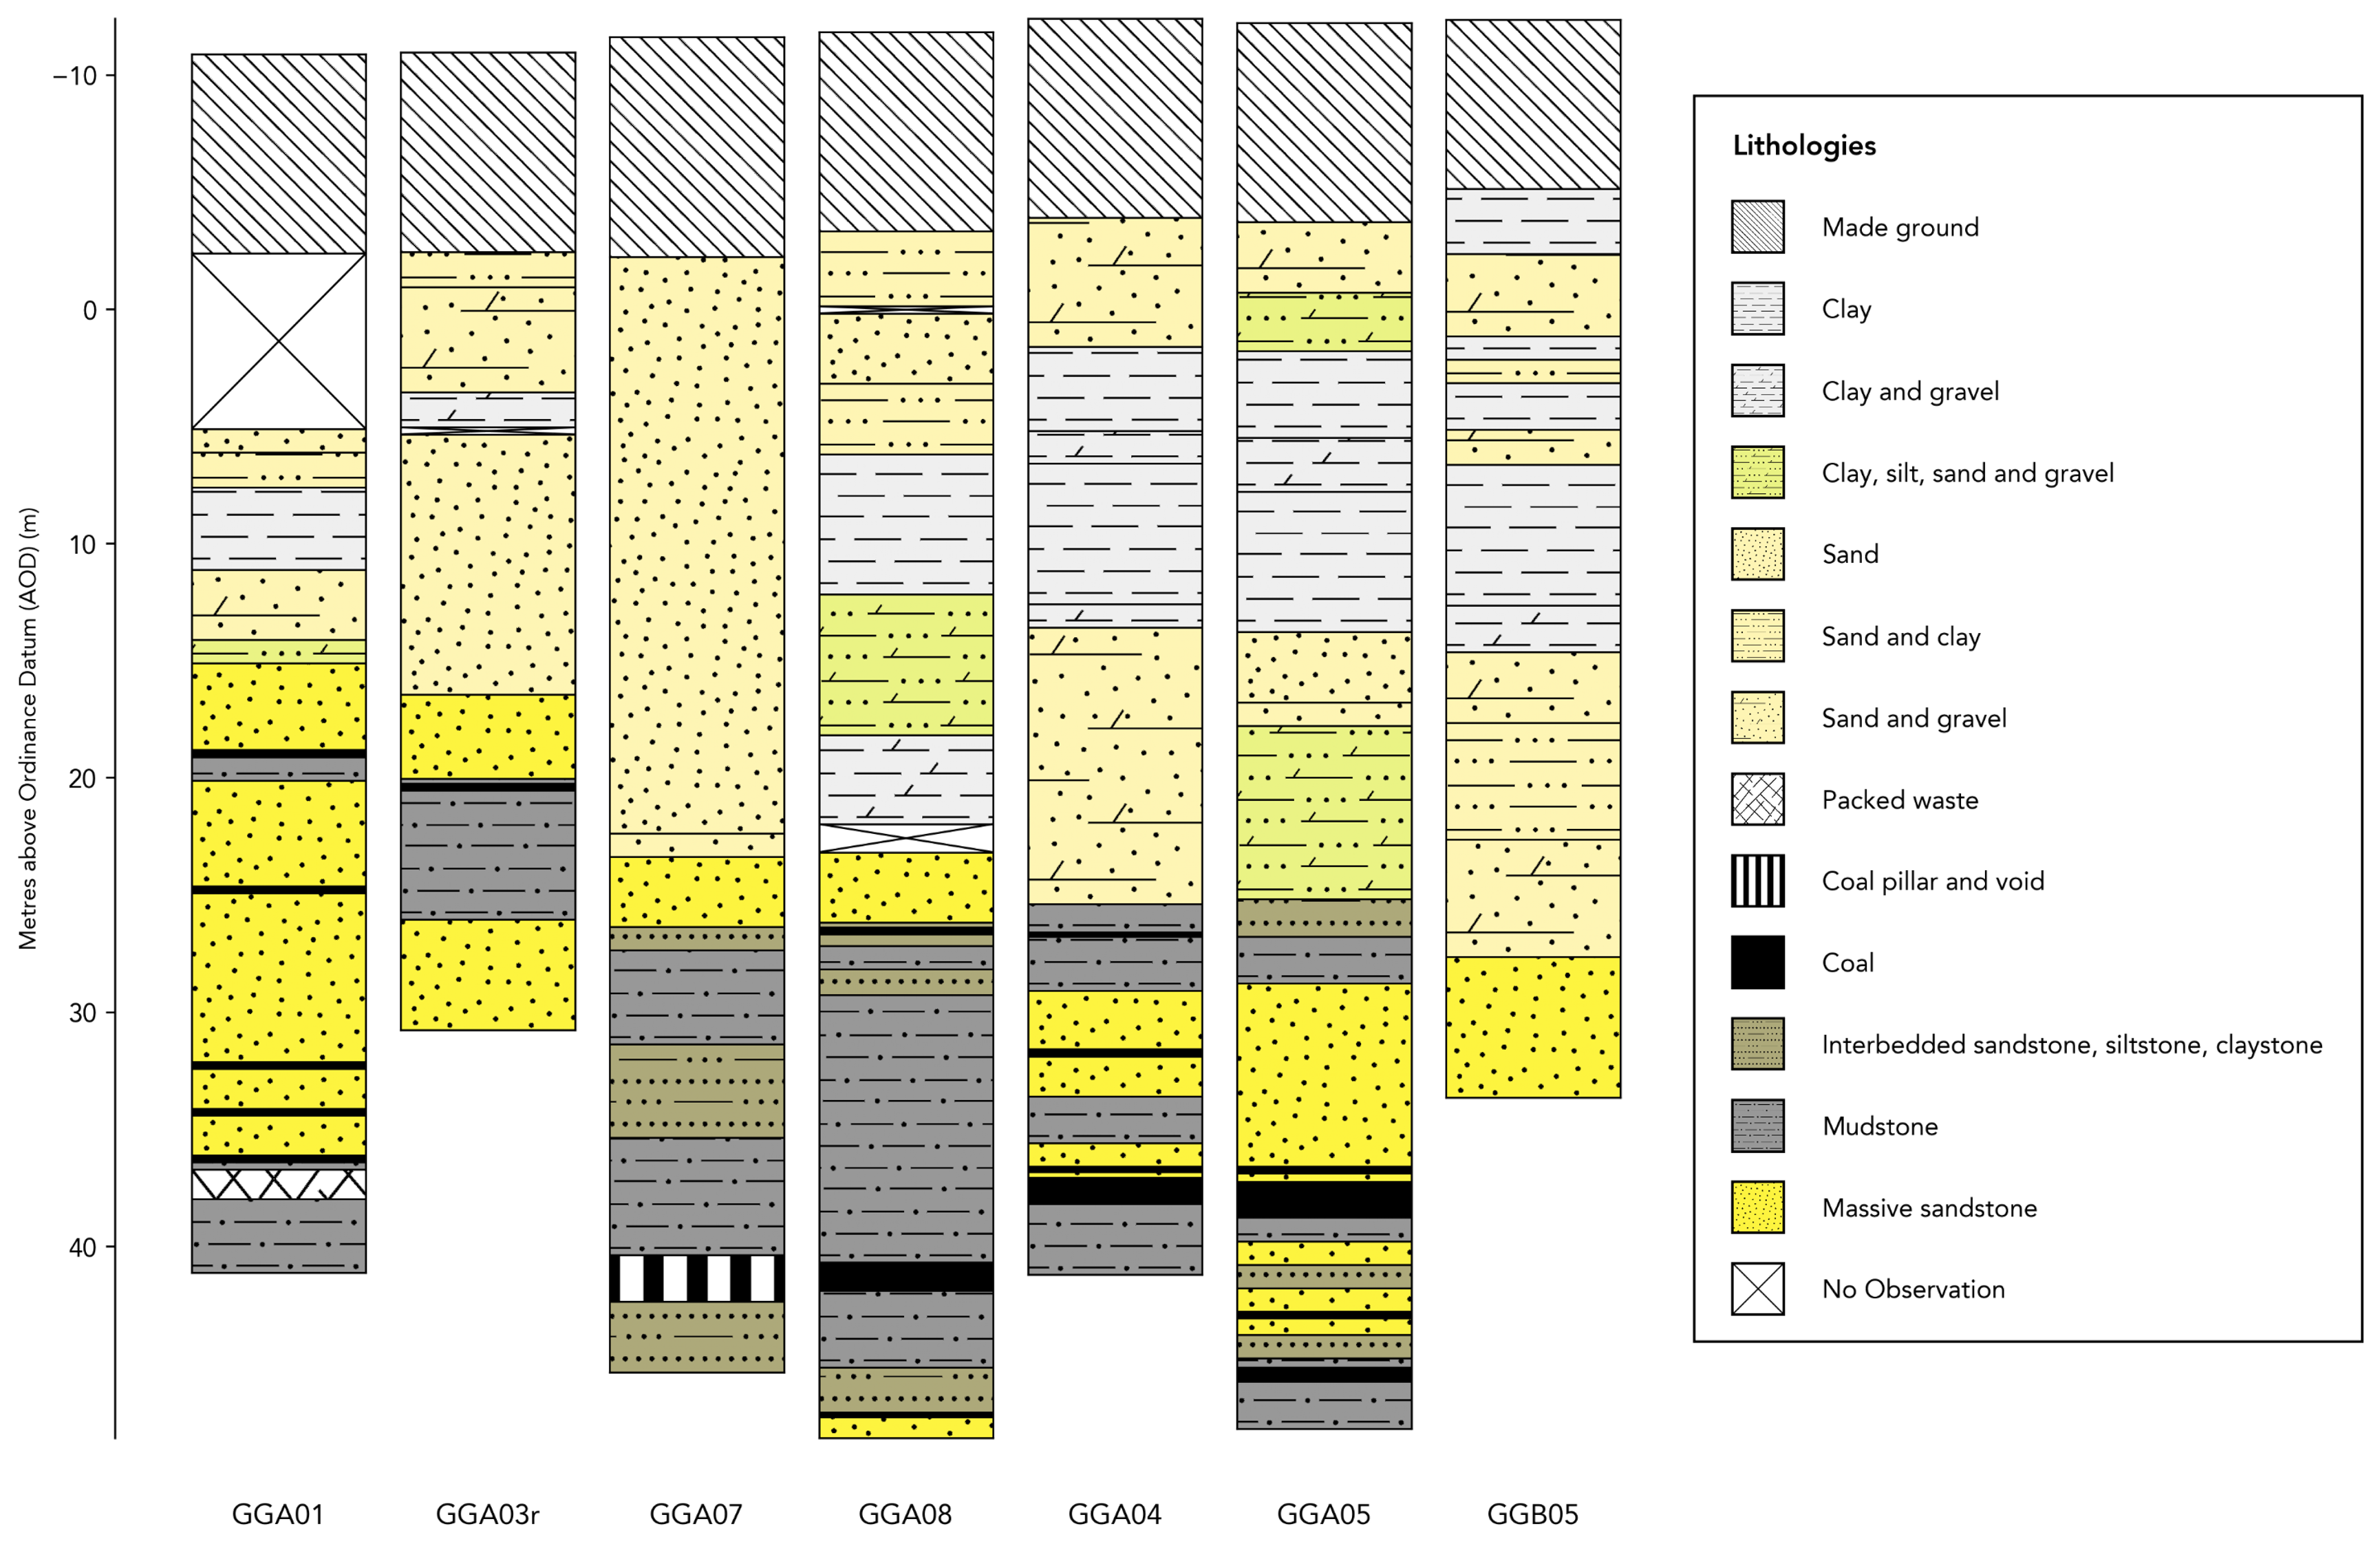
Aligned Borehole Logs
This example demonstrates a simple stratigraphic column with sedimentary units and annotations.
Keywords: borehole logs, aligned logs, correlated logs
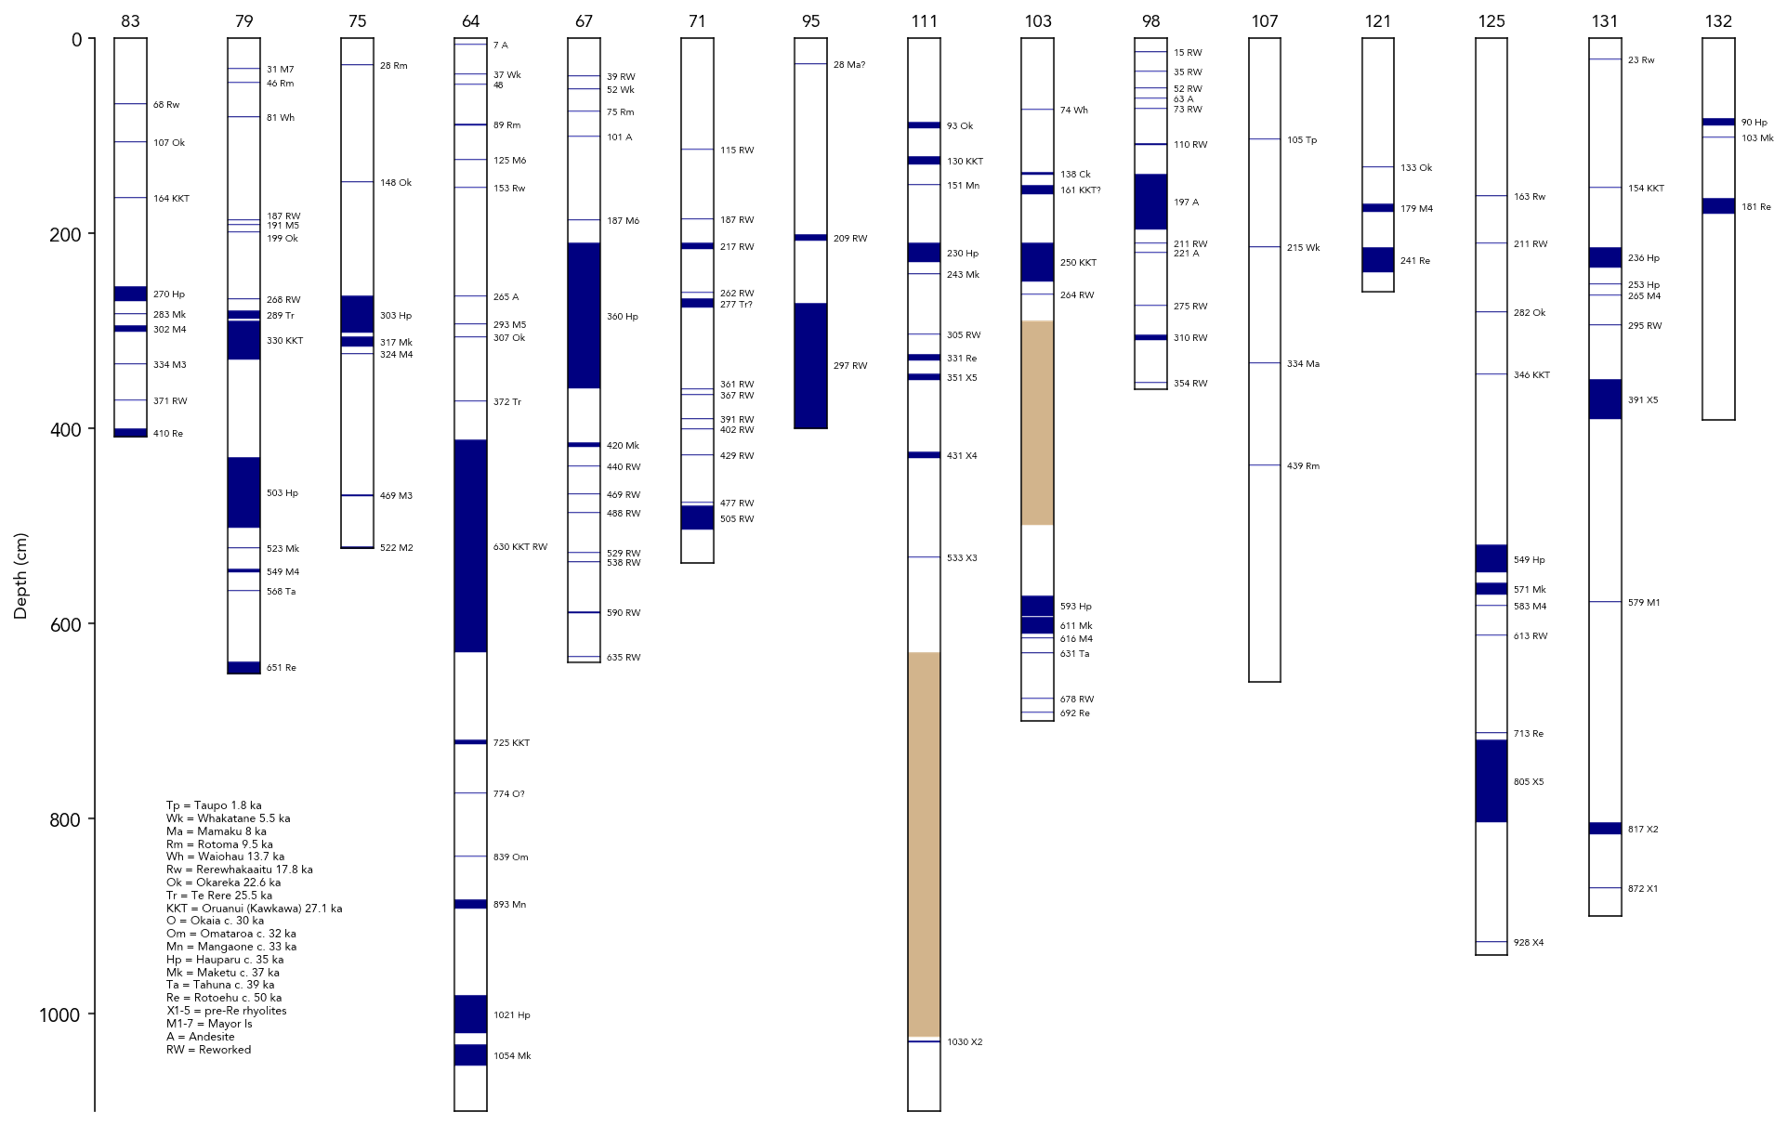
Tephrochronology
This example demonstrates a simple stratigraphic column with sedimentary units and annotations.
Keywords: tephrochronology, tephra, correlated logs, volcanic ash layers, geochronology
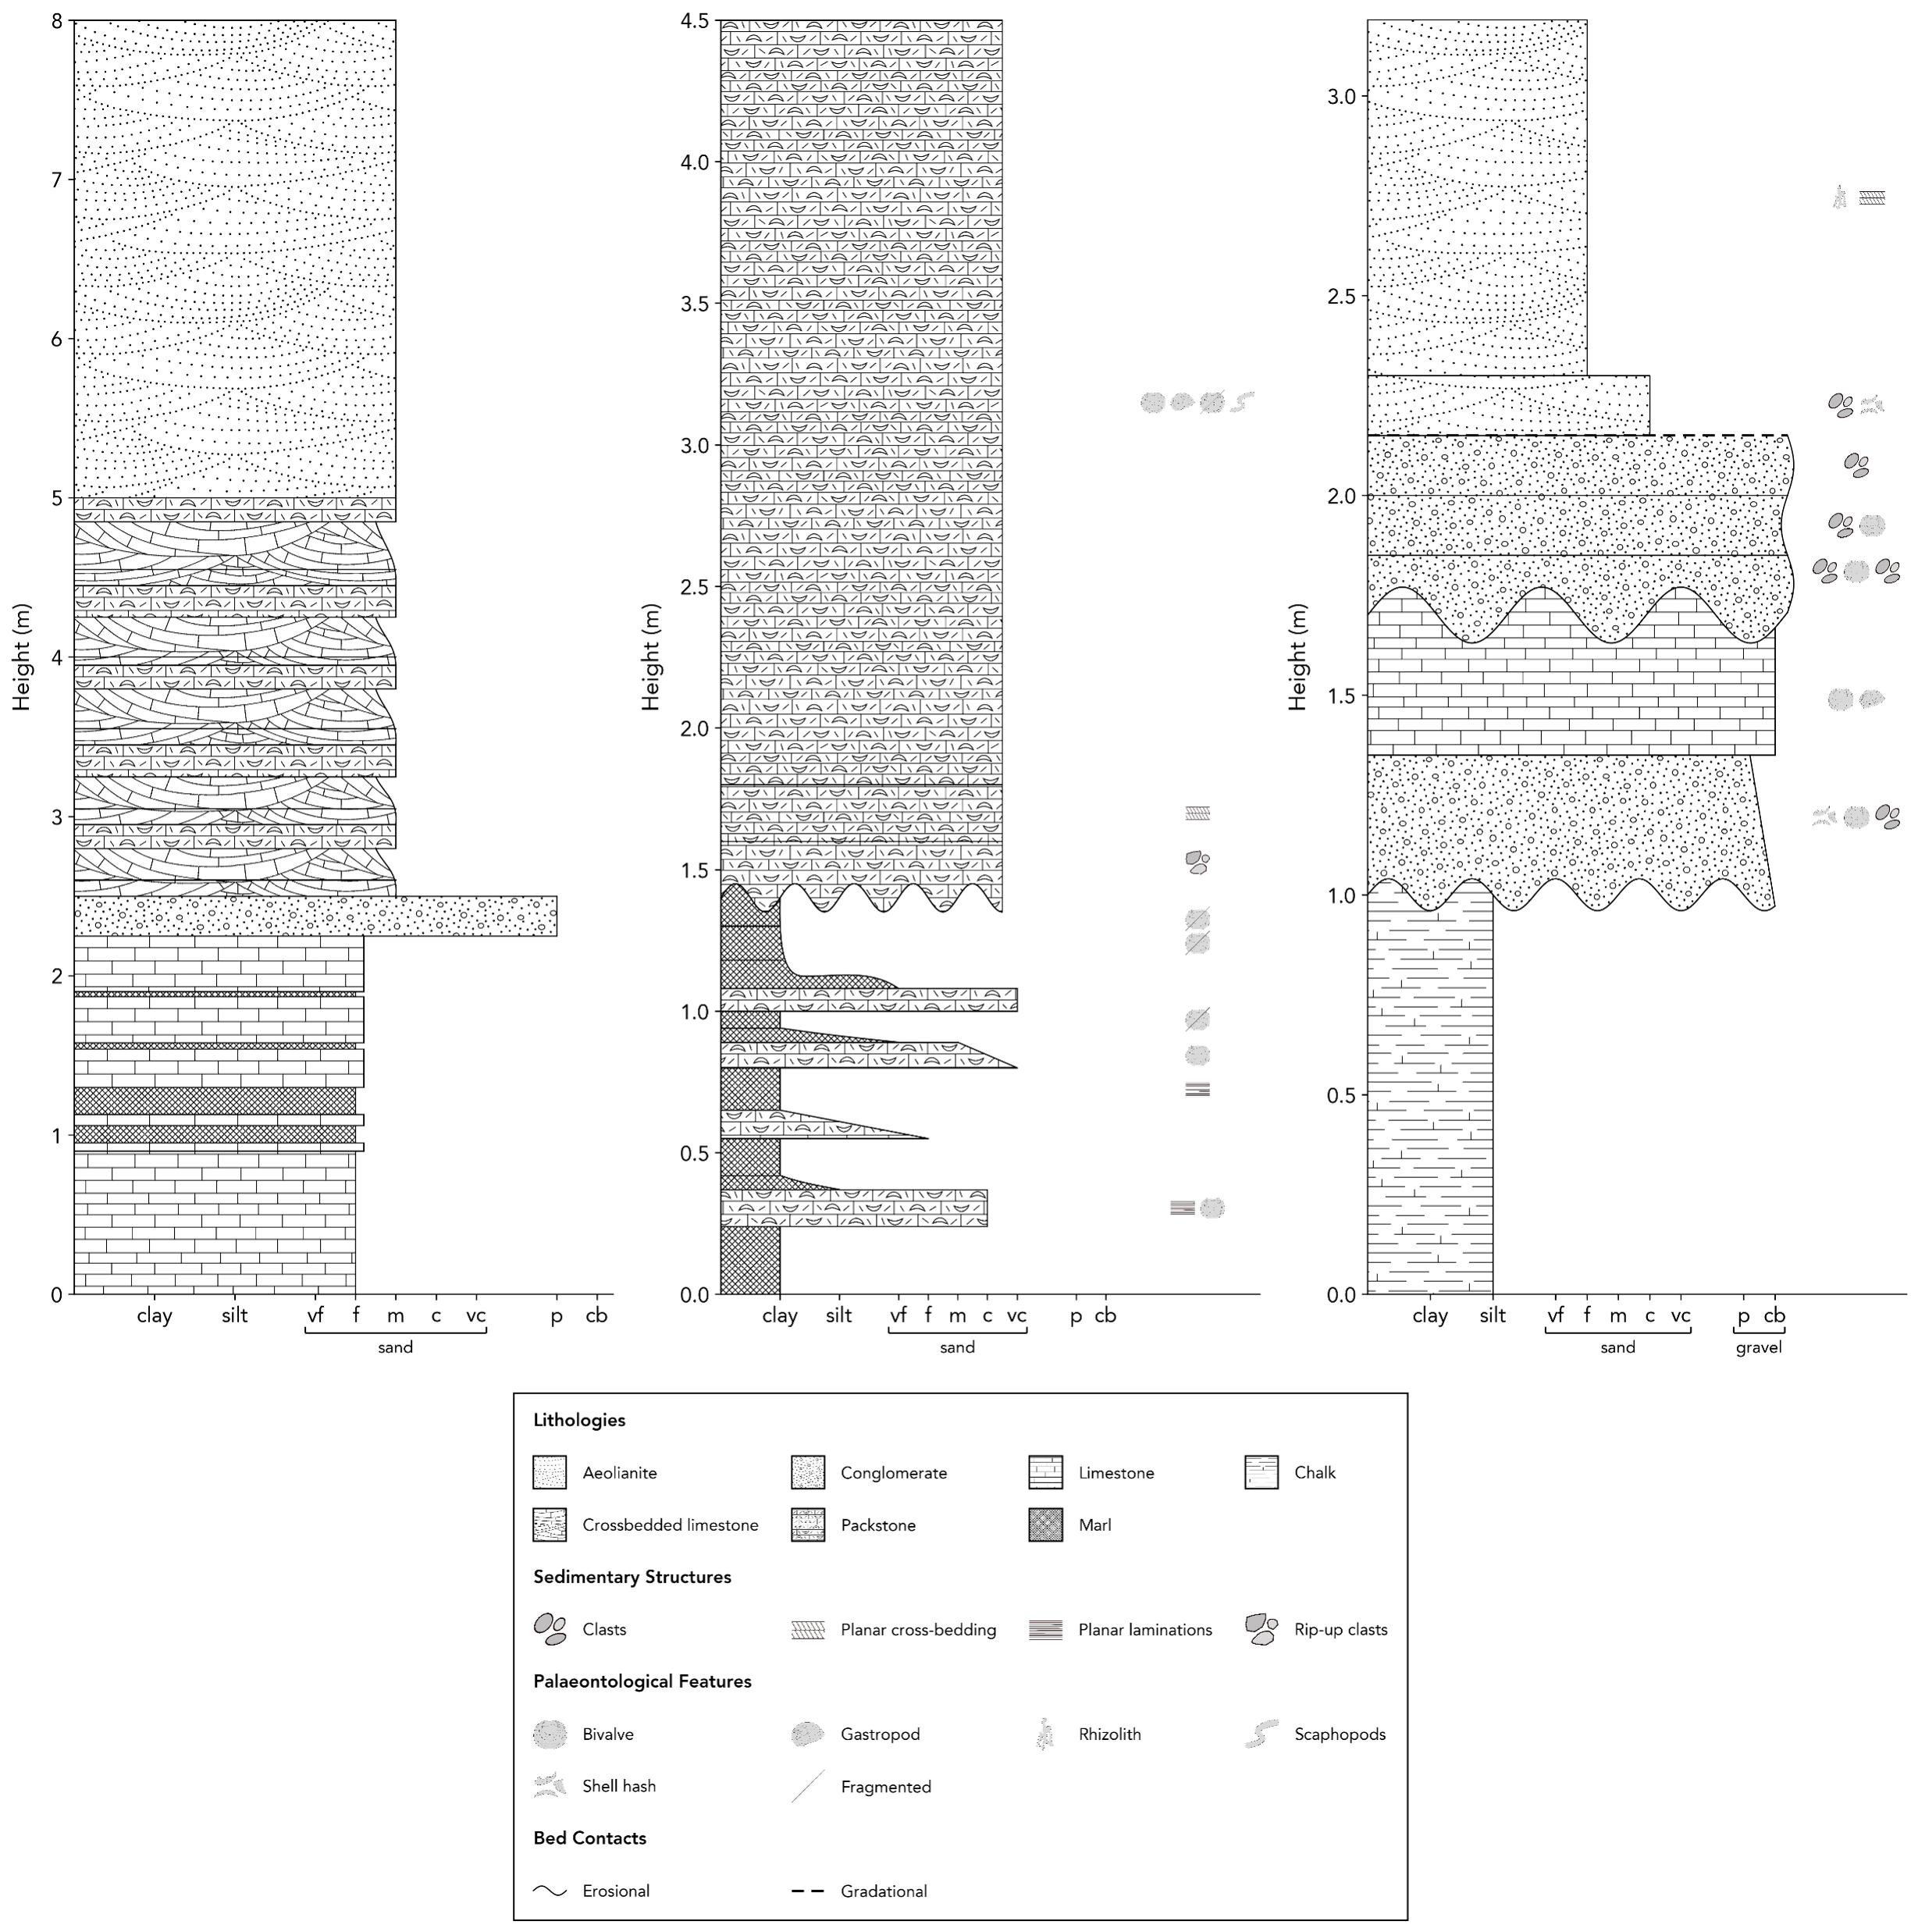
Multi-figure Sedimentary Logs
Three sedimentary logs are plotted in a single figure, with a shared legend and consistent formatting.
Keywords: multi figure logs, sedimentary logs, shared legend, Cyprus, black and white
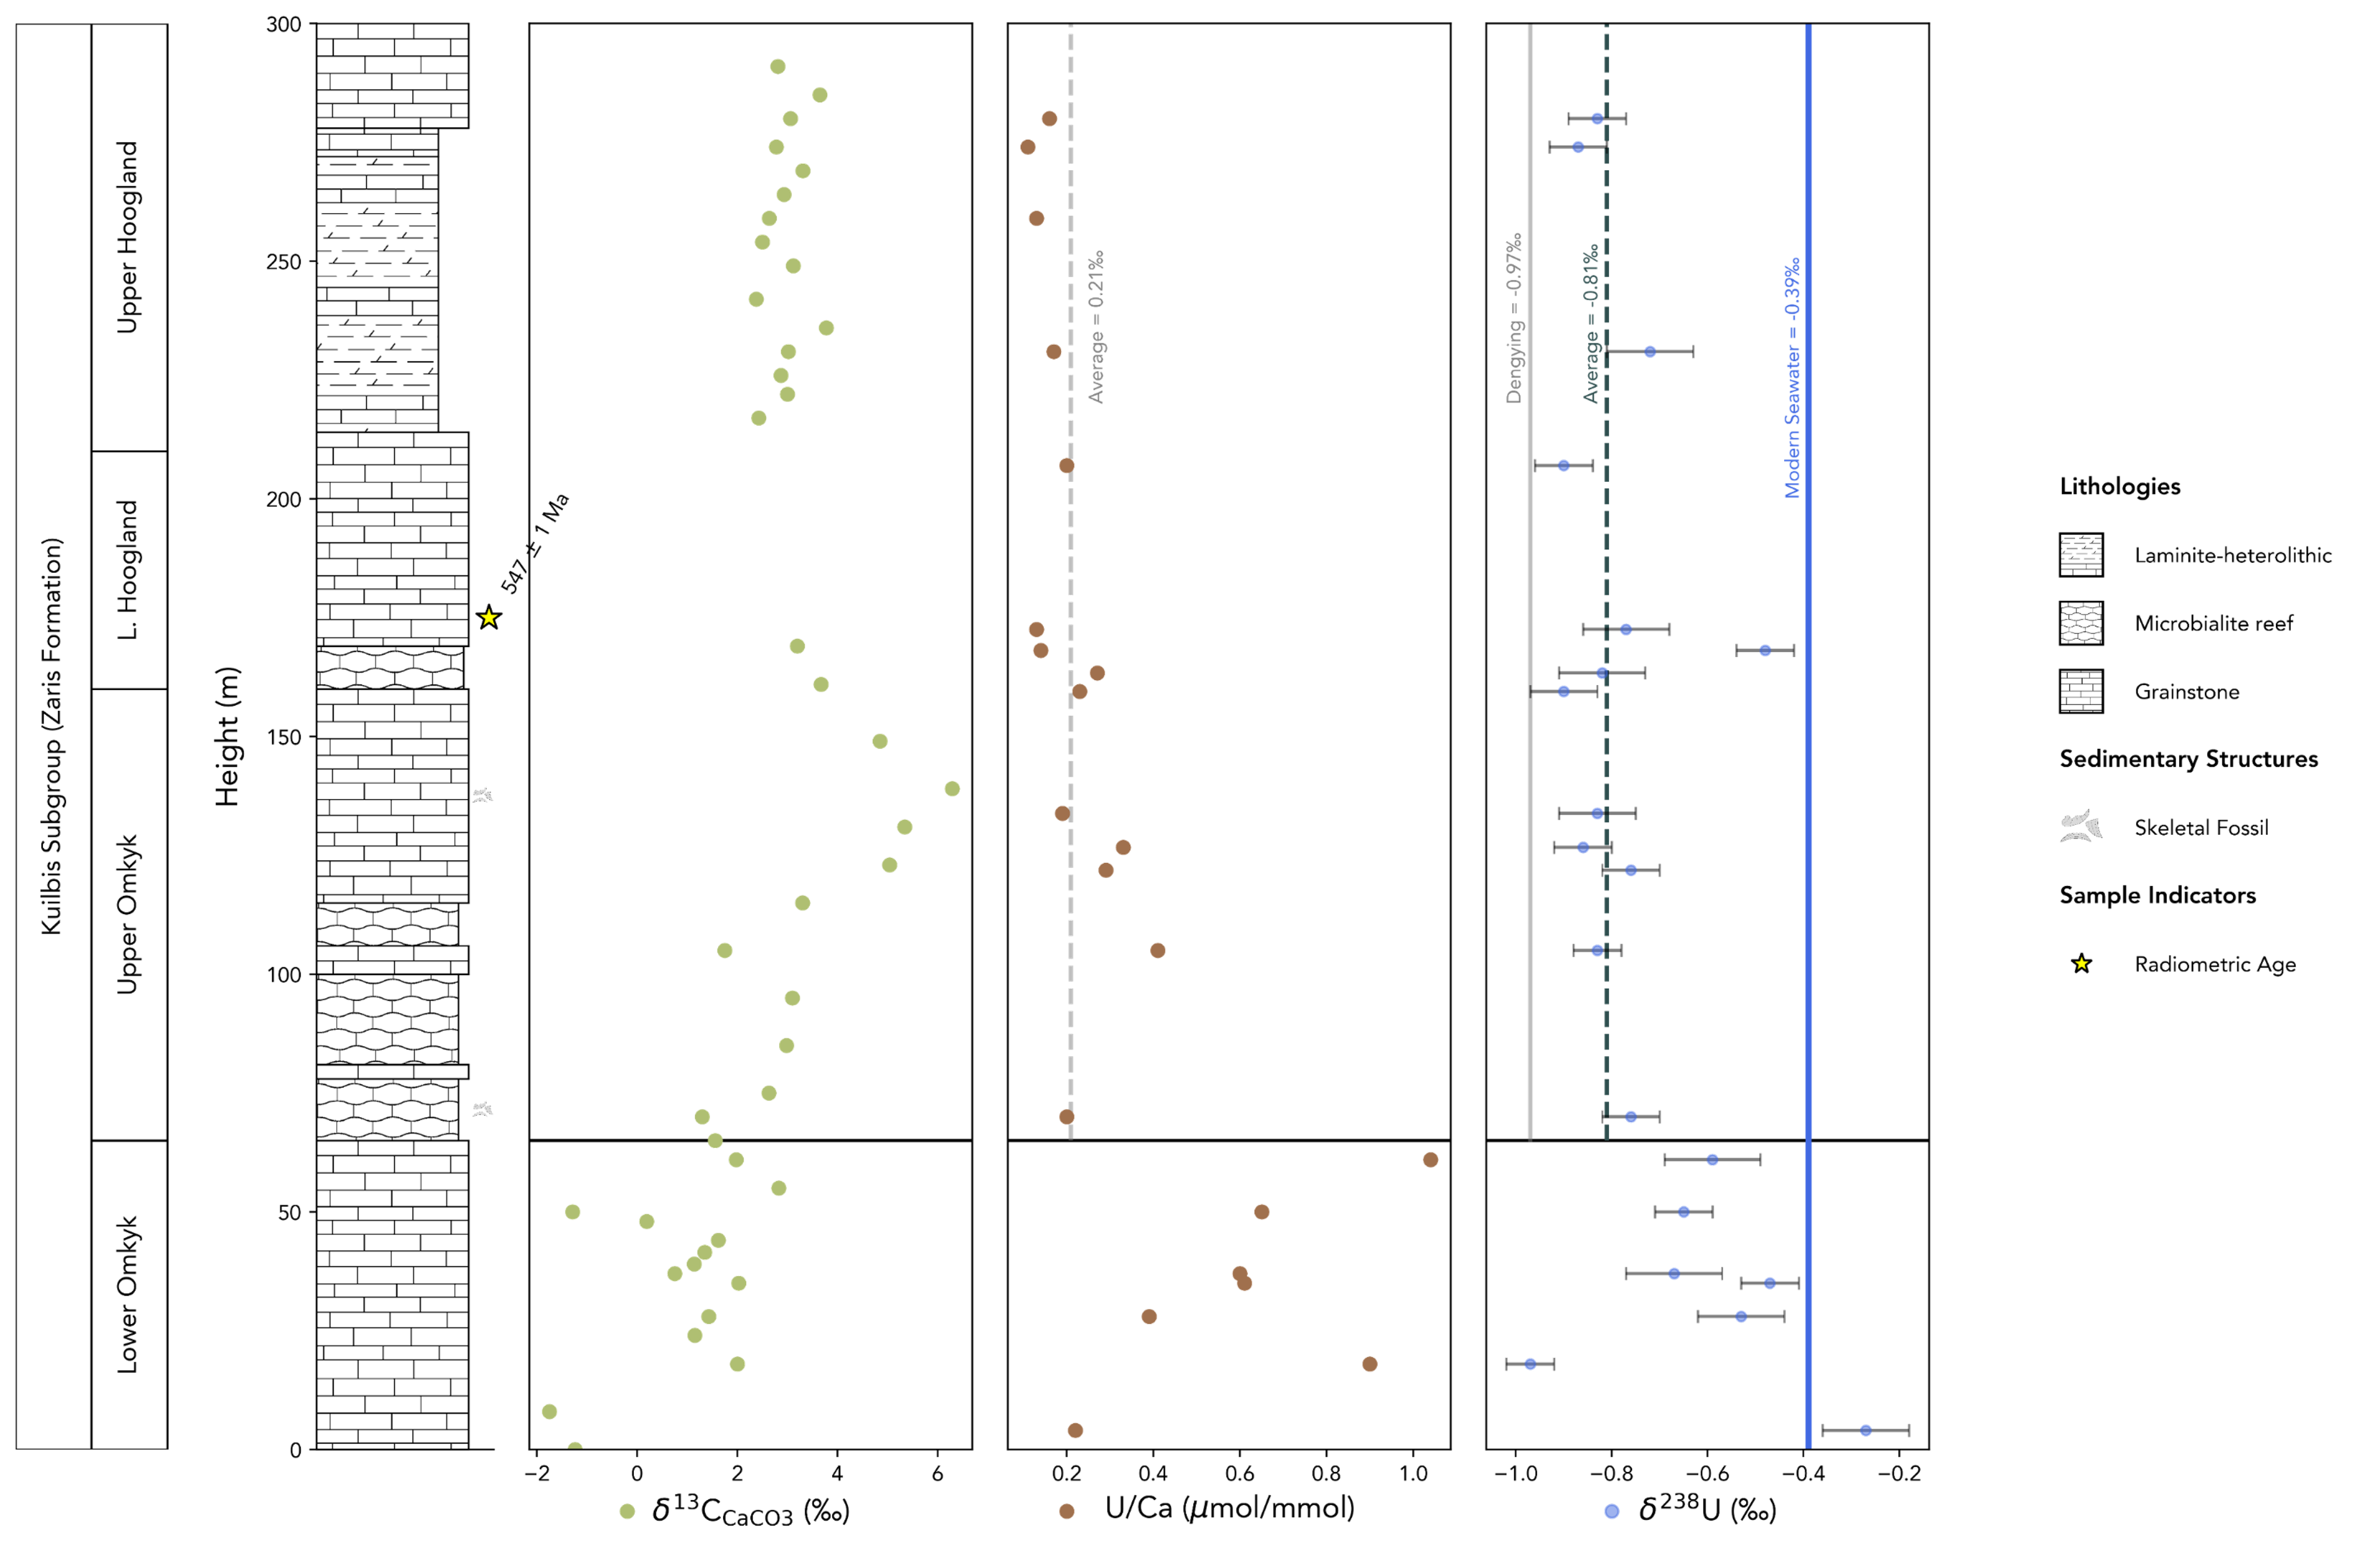
Geochemistry
Matplotlib is used to create a custom figure layout where a stratapy log is plotted alongside geochemical data and formation subdivisions. This example also uses the log.add_samples method to add a formatted point representing a radiometric age.
Keywords: geochemistry, custom figure layout, multi-figure, samples, radiometric age, formation subdivisions, matplotlib, black and white