Axis Labels
Axis labels are the text that appears alongside the horizontal (x) and vertical (y) axes of your plot. By default, stratapy does not plot an x-axis label, while the y-axis label is set to ‘Age’, ‘Depth’, or ‘Height’ depending on your data with units of ‘Ma’ or ‘m’, respectively. However, you can easily customise these labels to better suit your data and preferences.
Parameters for Axis Labels
When calling the plot() method, you can use the following keyword arguments to control the axis labels:
x_label: The label for the x-axis; default is no label ('')y_label: The label for the y-axis; default is ‘Age’, ‘Depth’, or ‘Height’ depending on your data.y_axis_unit: The unit for the y-axis; default is ‘Ma’ for age data and ‘m’ for depth/height data. You can set this to any string, such as ‘ft’ for feet.
Example Usage
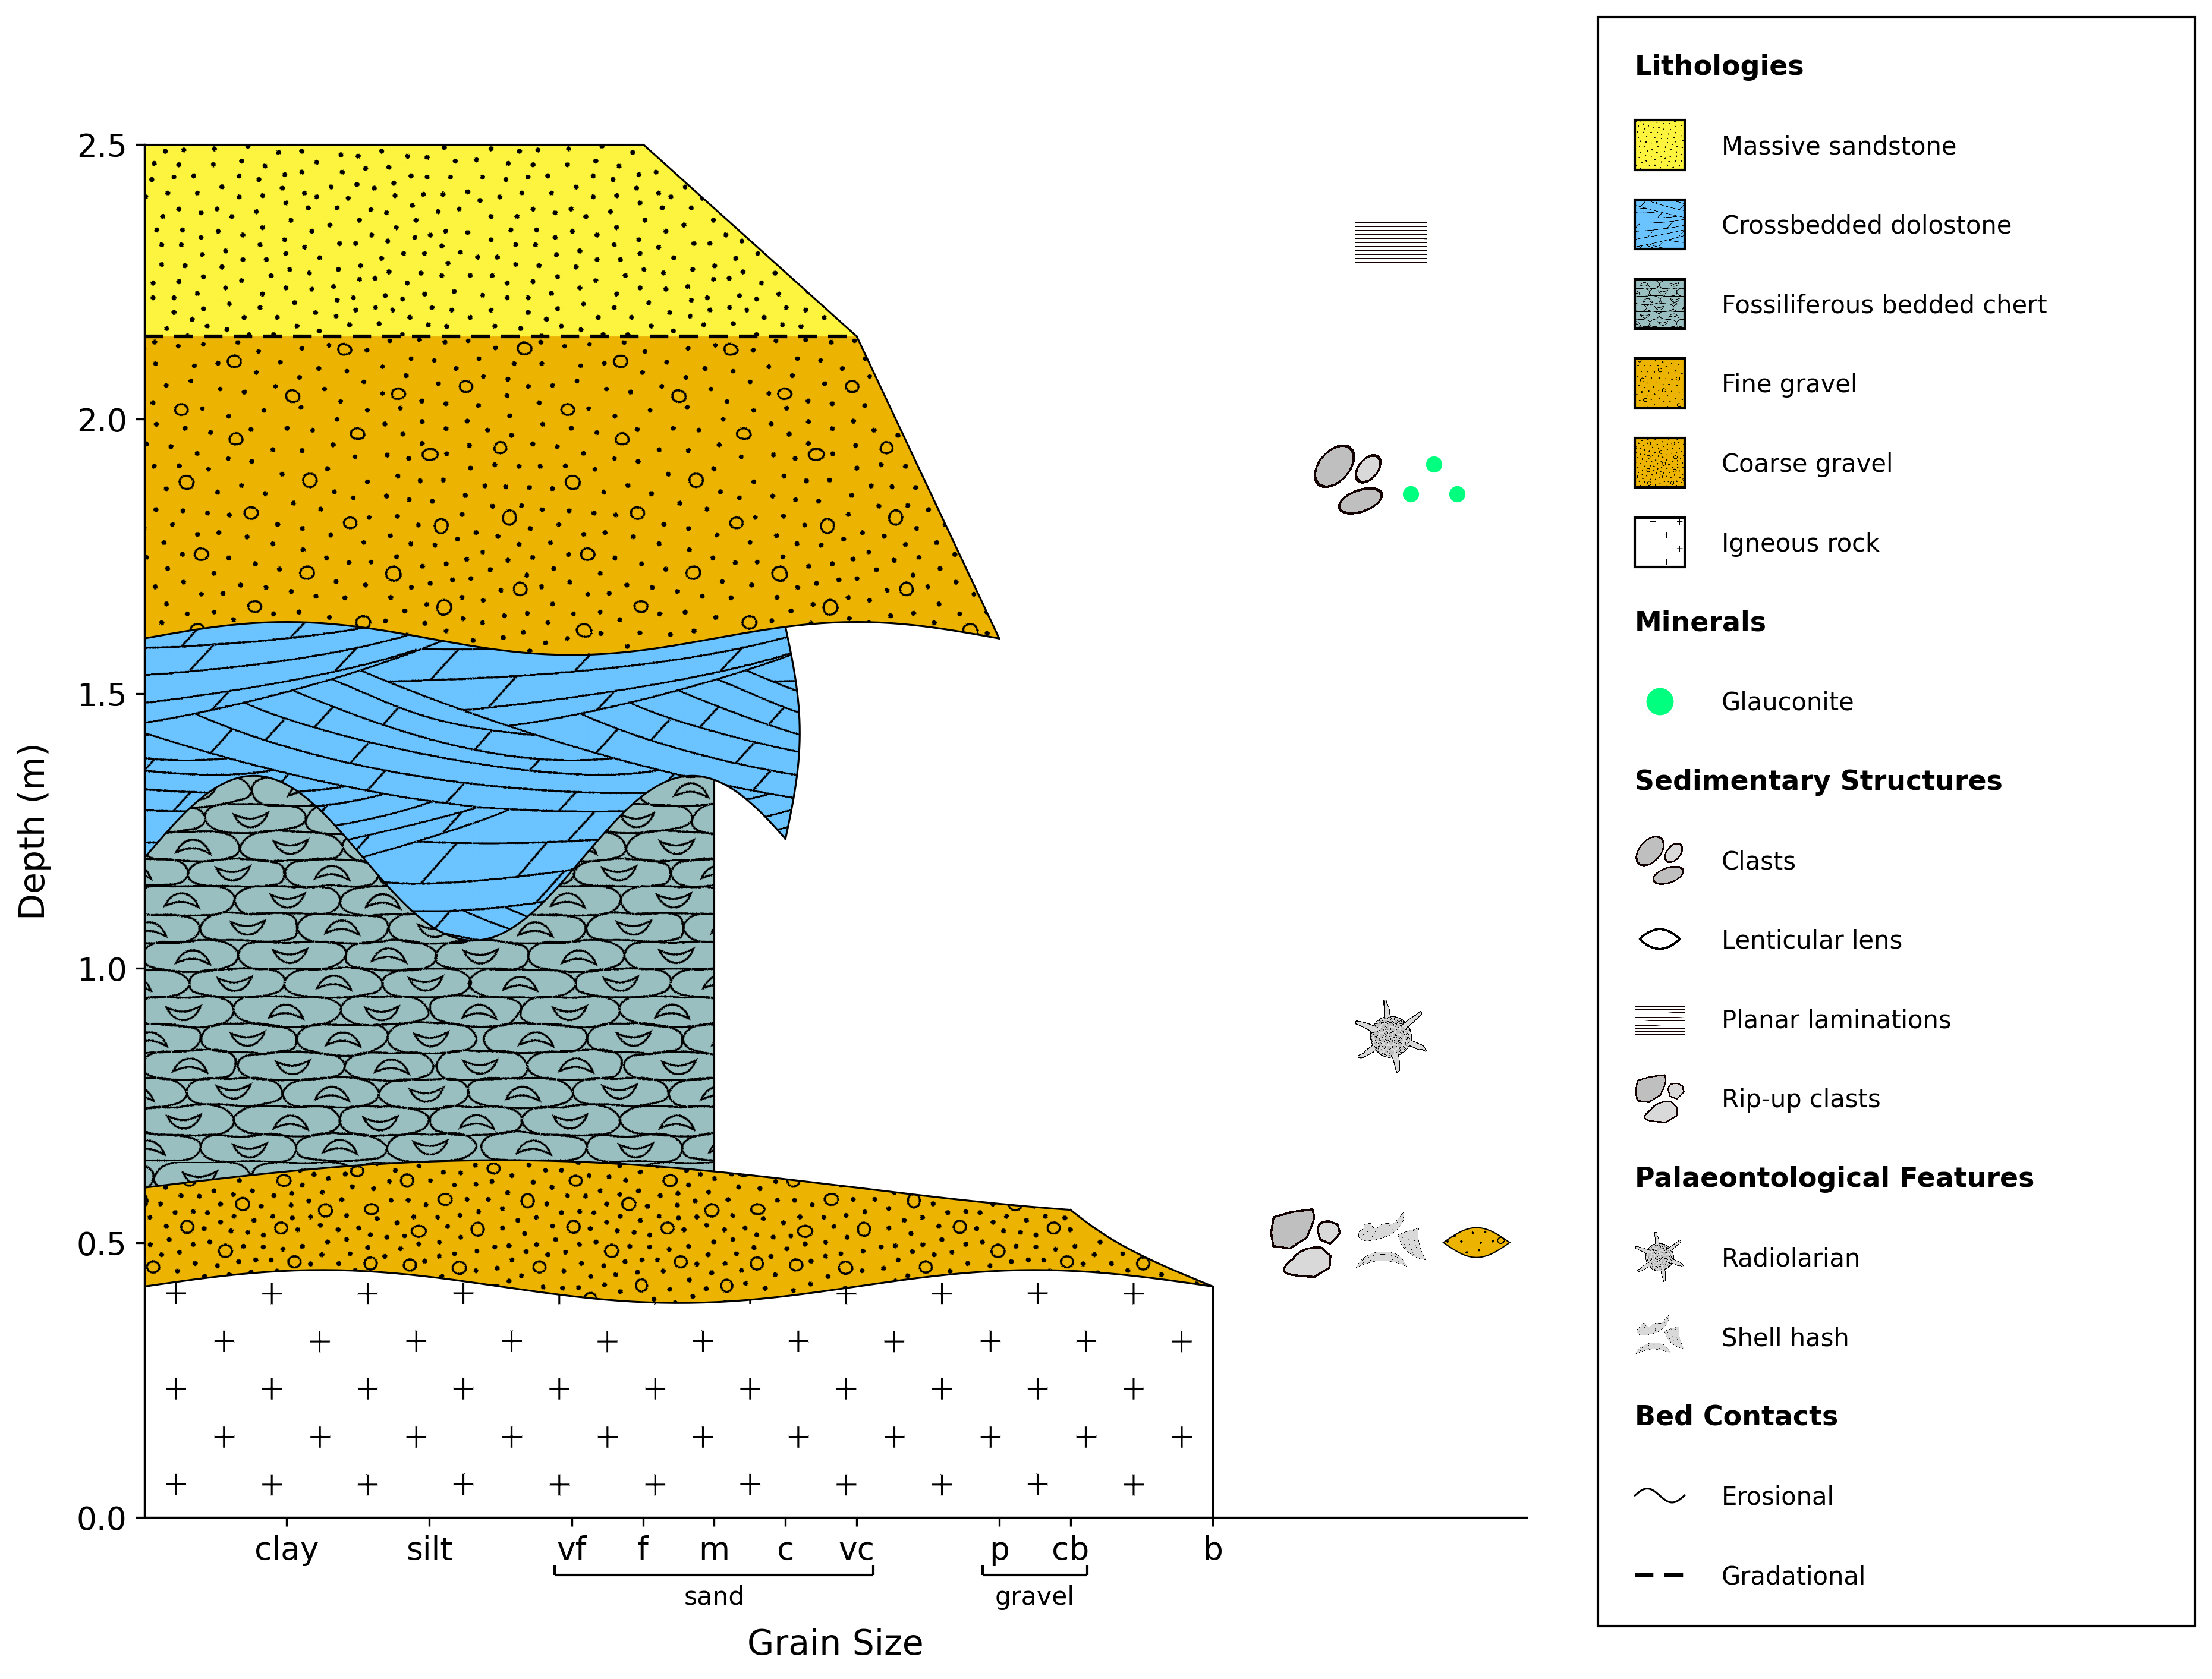
log = sp.load('examples.tutorial.csv')
log.plot(
    x_label='Grain Size',
    y_label='Depth',
    y_axis_unit='m'
)
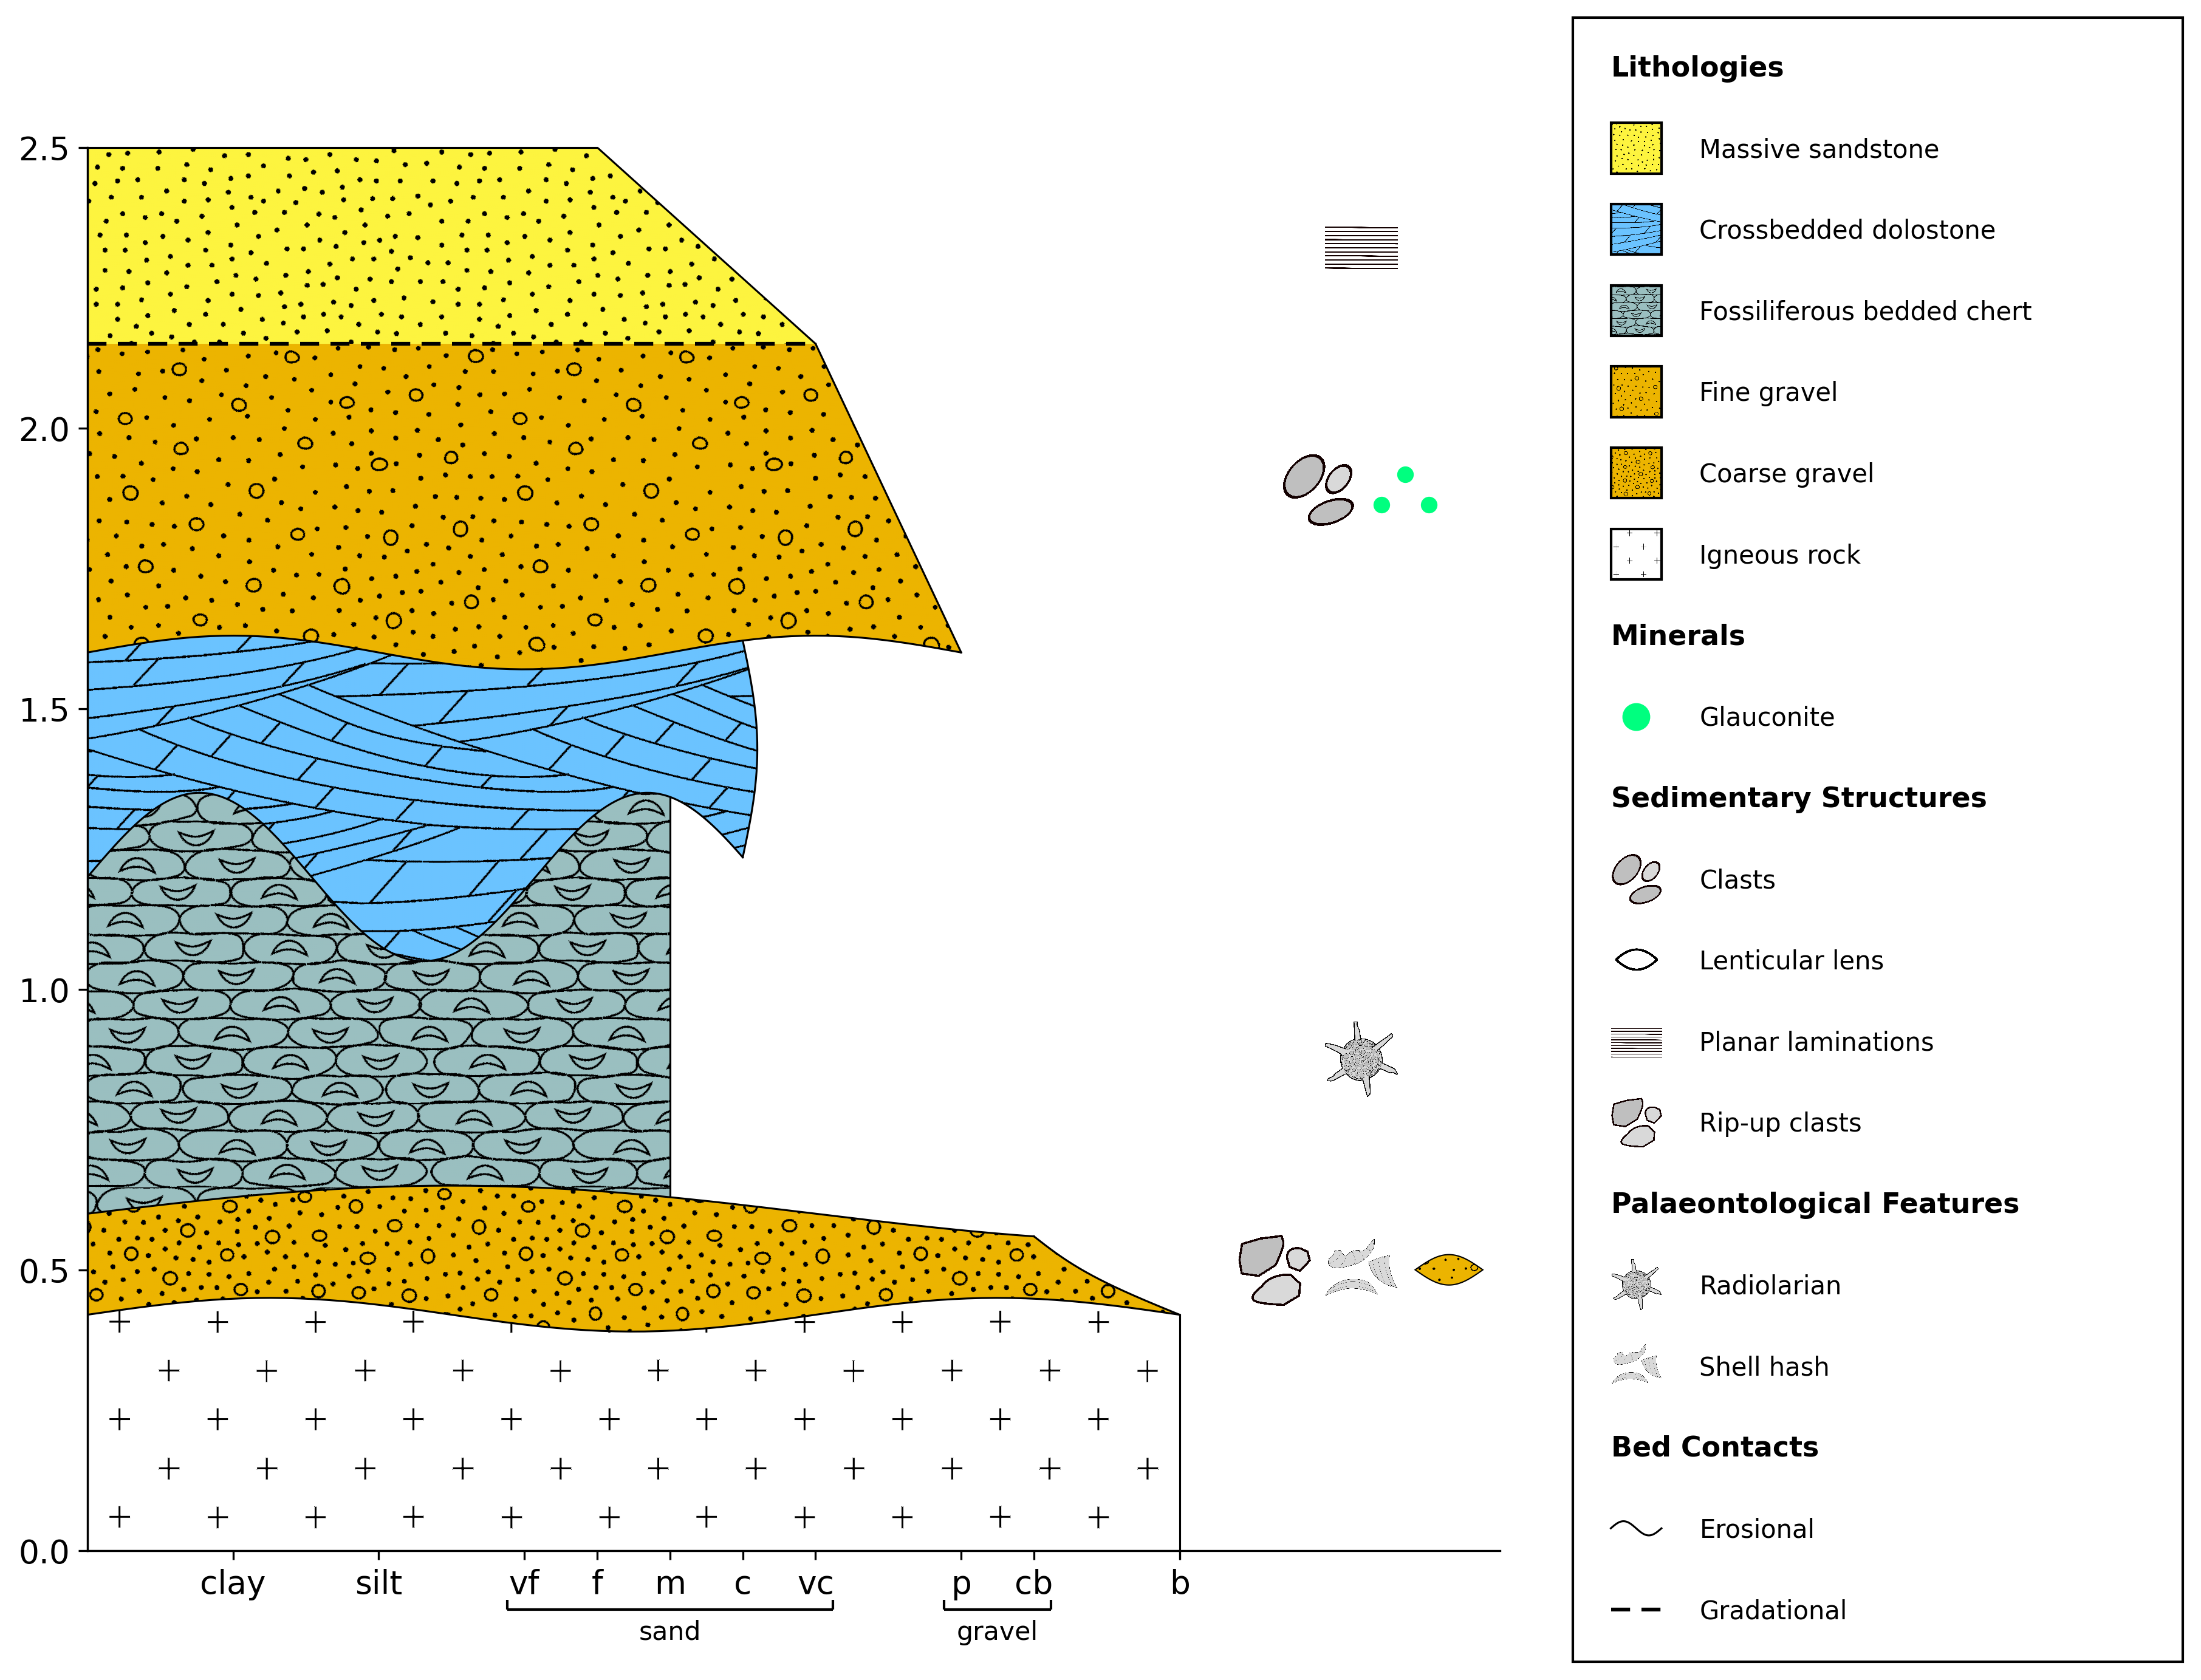
log = sp.load('examples.tutorial.csv')
log.plot(
    x_label='',
    y_label='Distance Below Sea Level',
    y_axis_unit='cm',
)
If you do not want an axis label to appear, simply set it to an empty string:
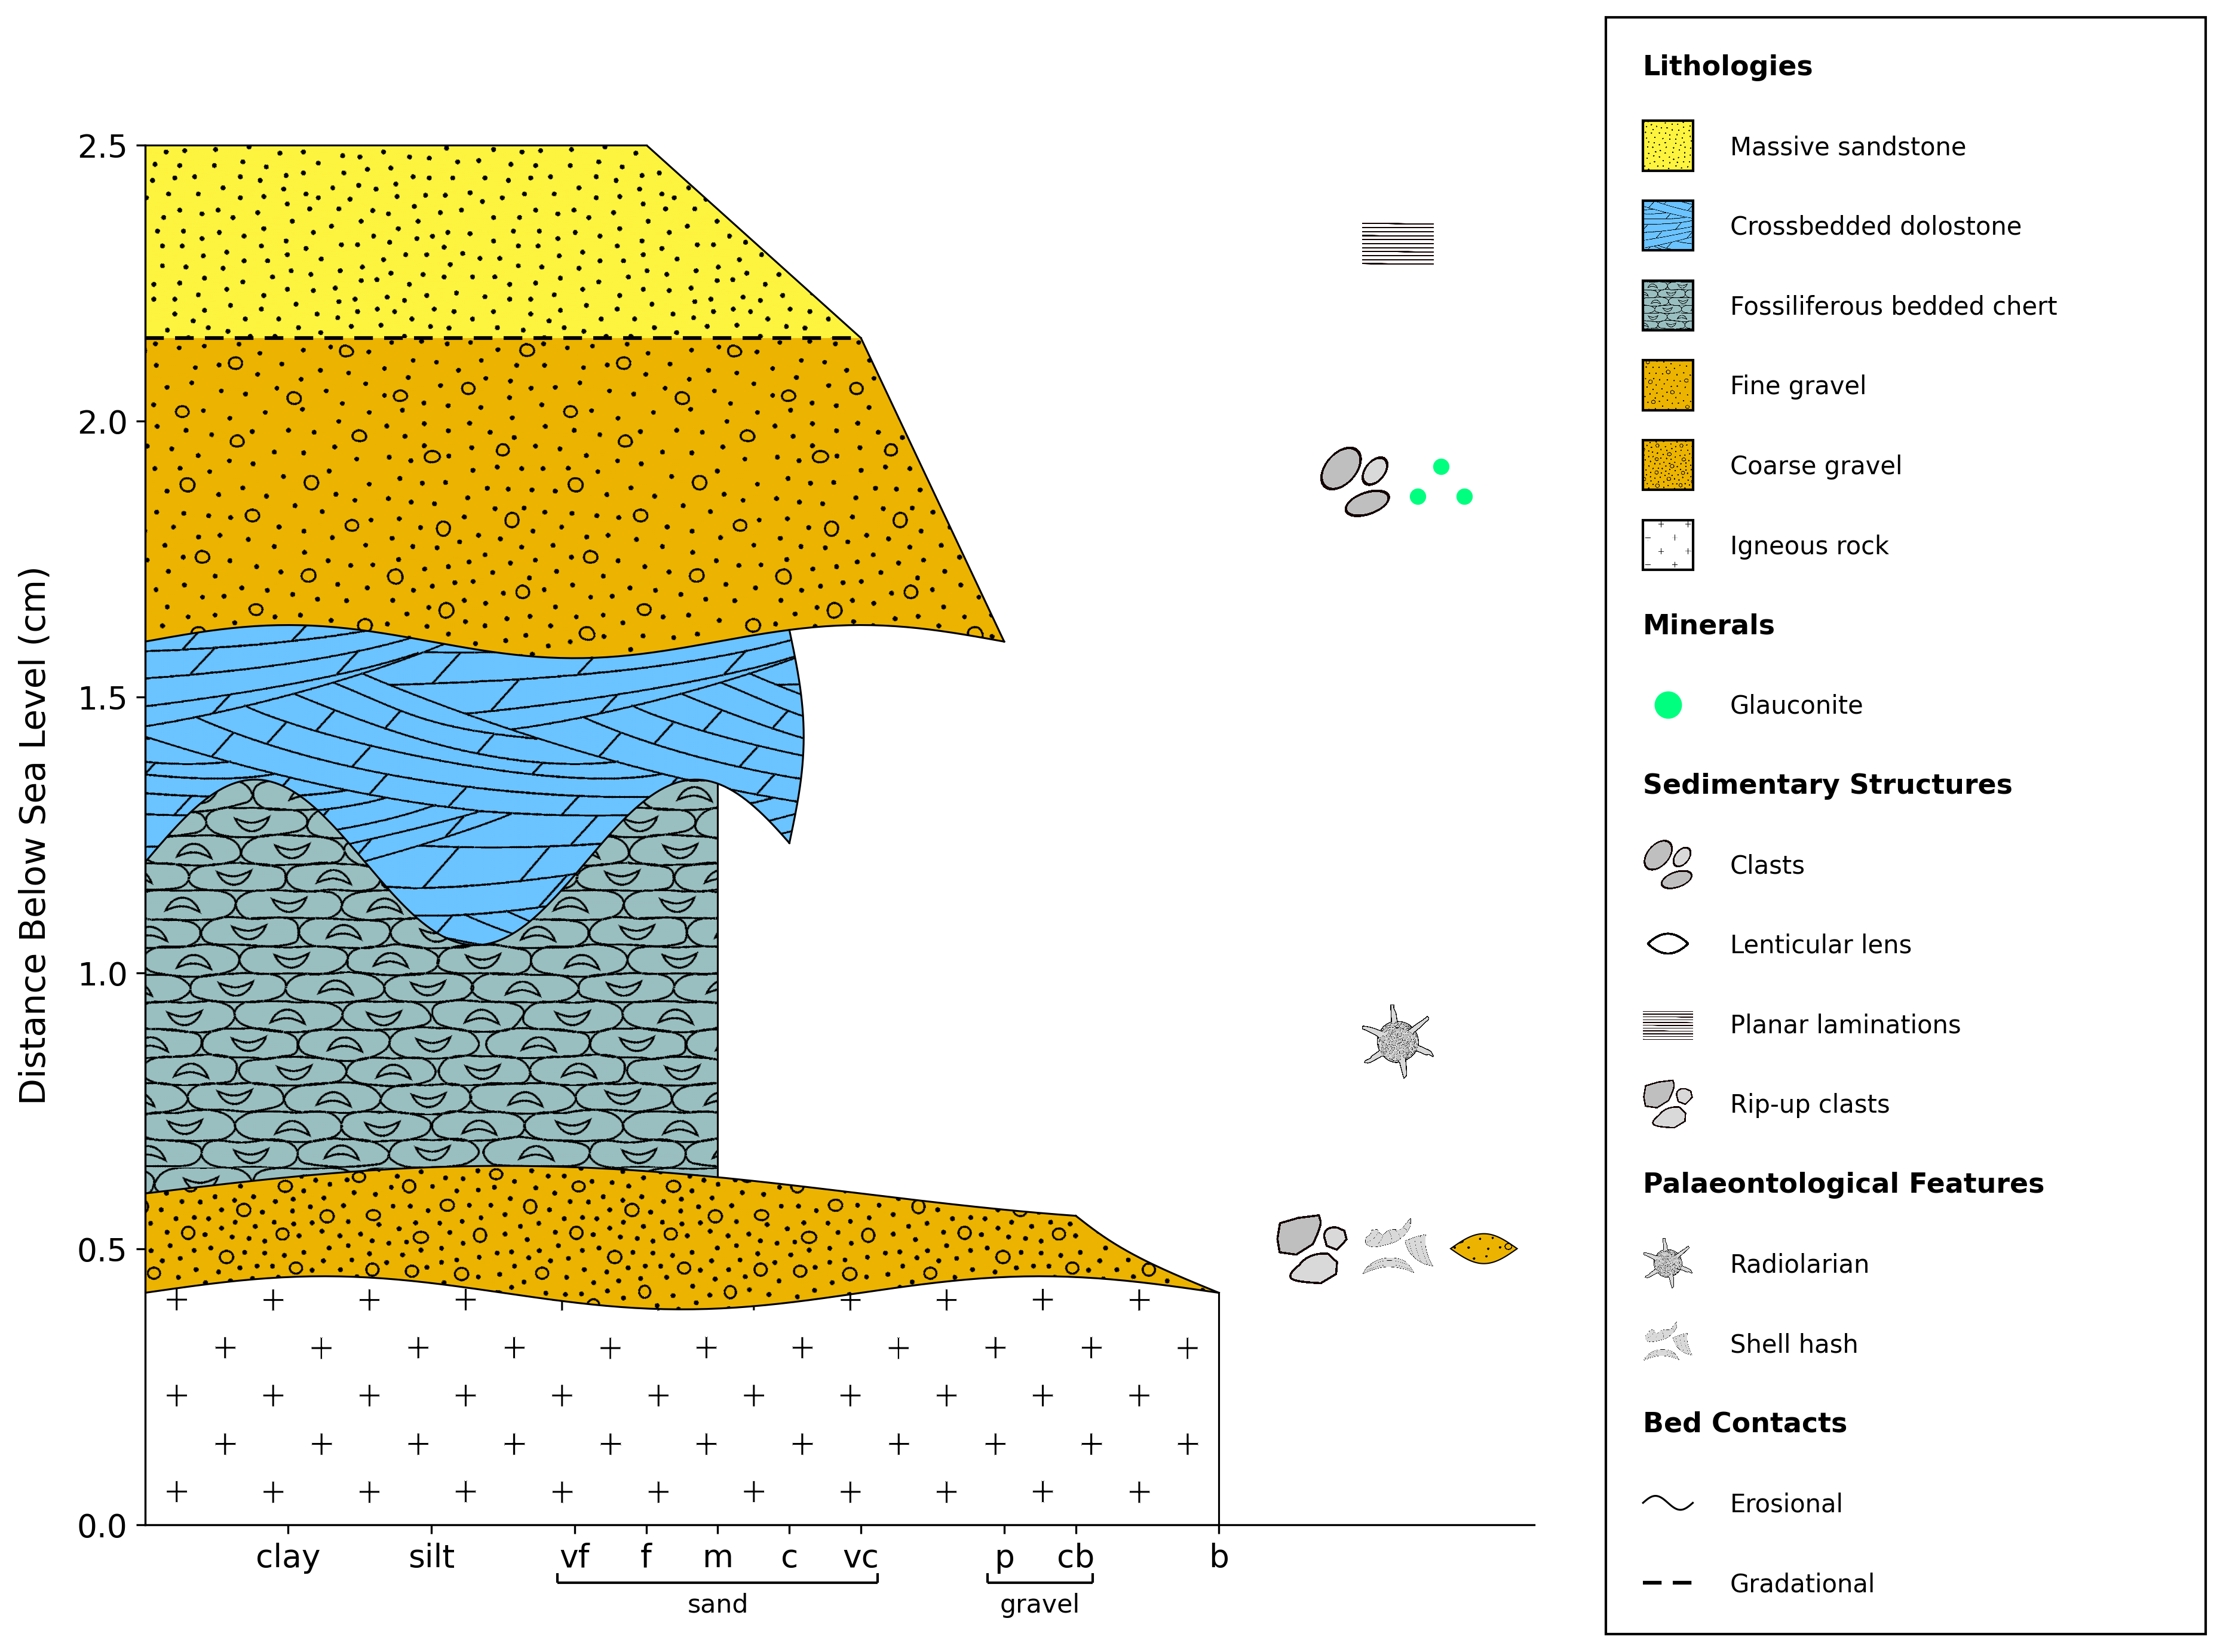
log = sp.load('examples.tutorial.csv')
log.plot(
    x_label='',
    y_label='',
    y_axis_unit='',
)