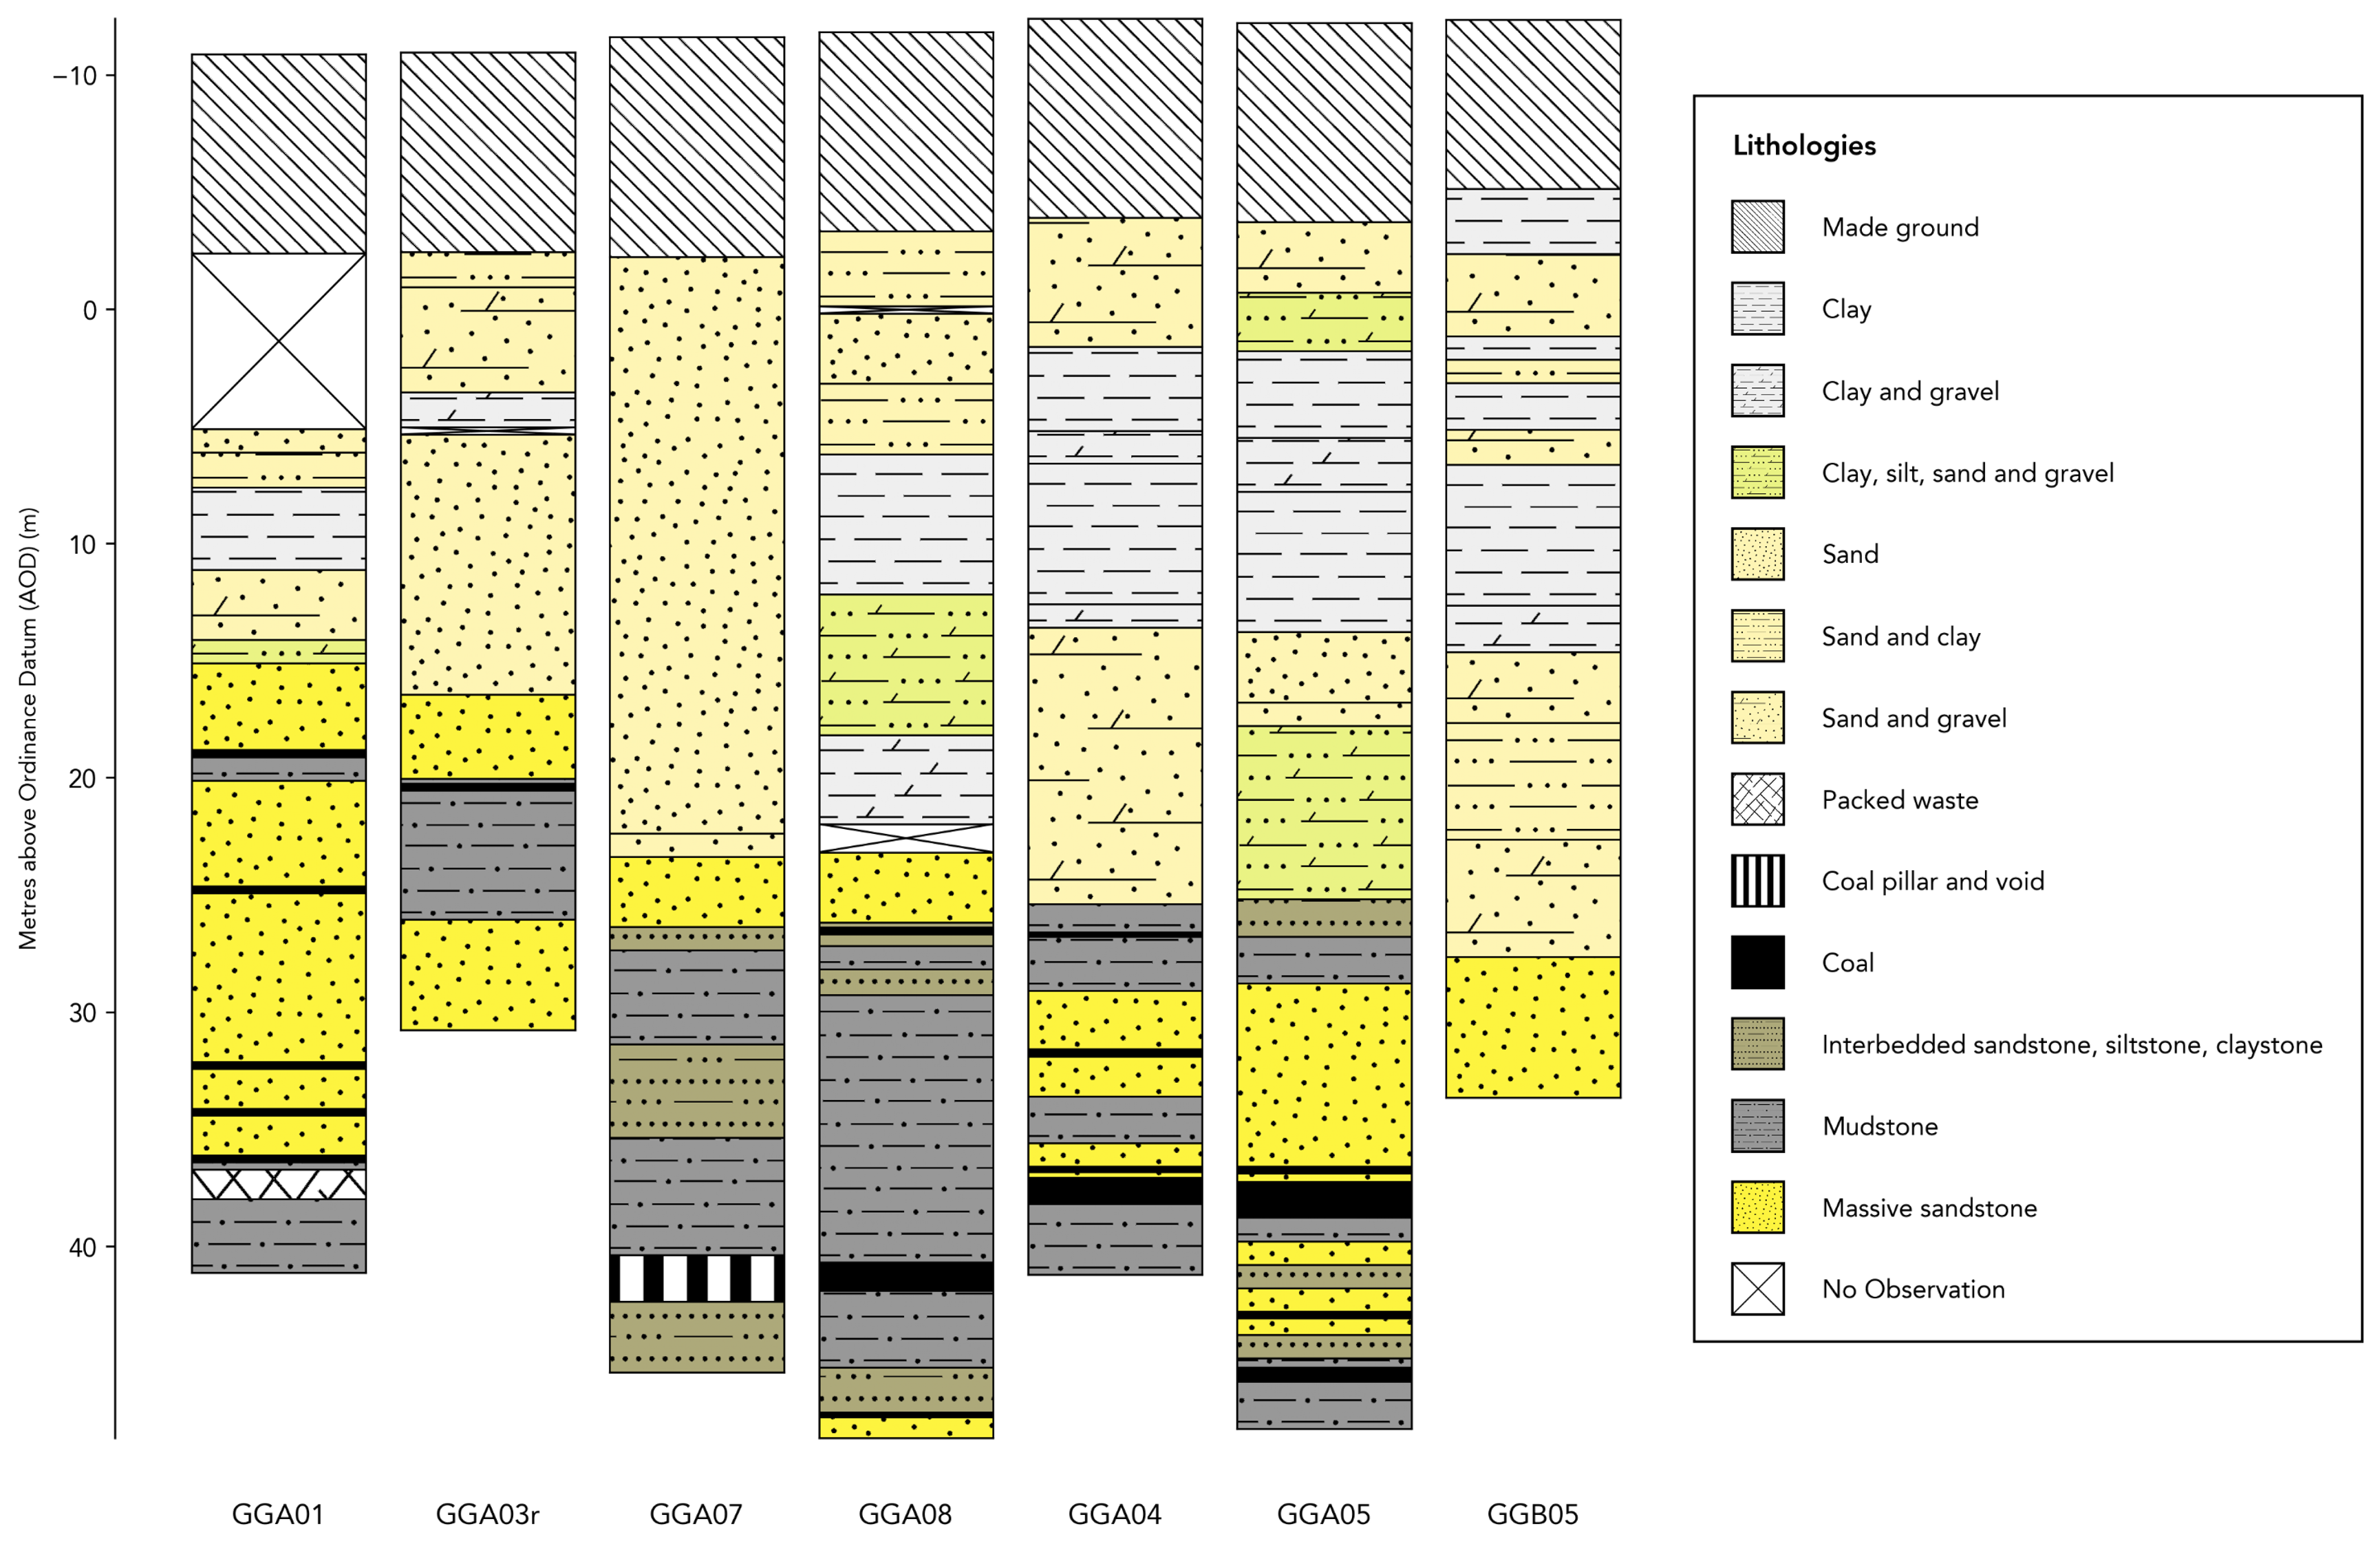
Aligned Boreholes
This example uses multi_fig() to plot side-by-side borehole logs with custom formatting from the British Geological Survey’s [UK Geoenergy Observatories project](https://www.bgs.ac.uk/ukgeos/).
Code to reproduce this figure:
# Create the list of log names and corresponding file paths
log_names = ['GGA01', 'GGA03r', 'GGA07', 'GGA08', 'GGA04', 'GGA05', 'GGB05']
files = [f'examples.UKGeos_{name}.csv' for name in log_names]

# Use the correlated_logs function to create the panel of logs automatically, with custom arguments for formatting and appearance
panel = sp.correlated_logs(files, figsize=(10, 10), left_y_axis=True, dpi=300, y_label='Metres above Ordinance Datum (AOD)')

# Add a title and labels for each log
for i, ax in enumerate(panel.axes):
    ax.set_xlabel(log_names[i], fontsize=11)
Data used to generate this figure:
These files are built into stratapy, the code above will work without any need to download or specify file paths.