Features, Minerals & Lenses
In the same way we can change the layout of the log, we can also adjust how features, minerals, and lenses are displayed within a log using optional keyword arguments passed to the LogObject.plot() function. The presence of these elements in a log is determined by the relevant columns of the input file, and the following options allow us to modify how they are displayed.
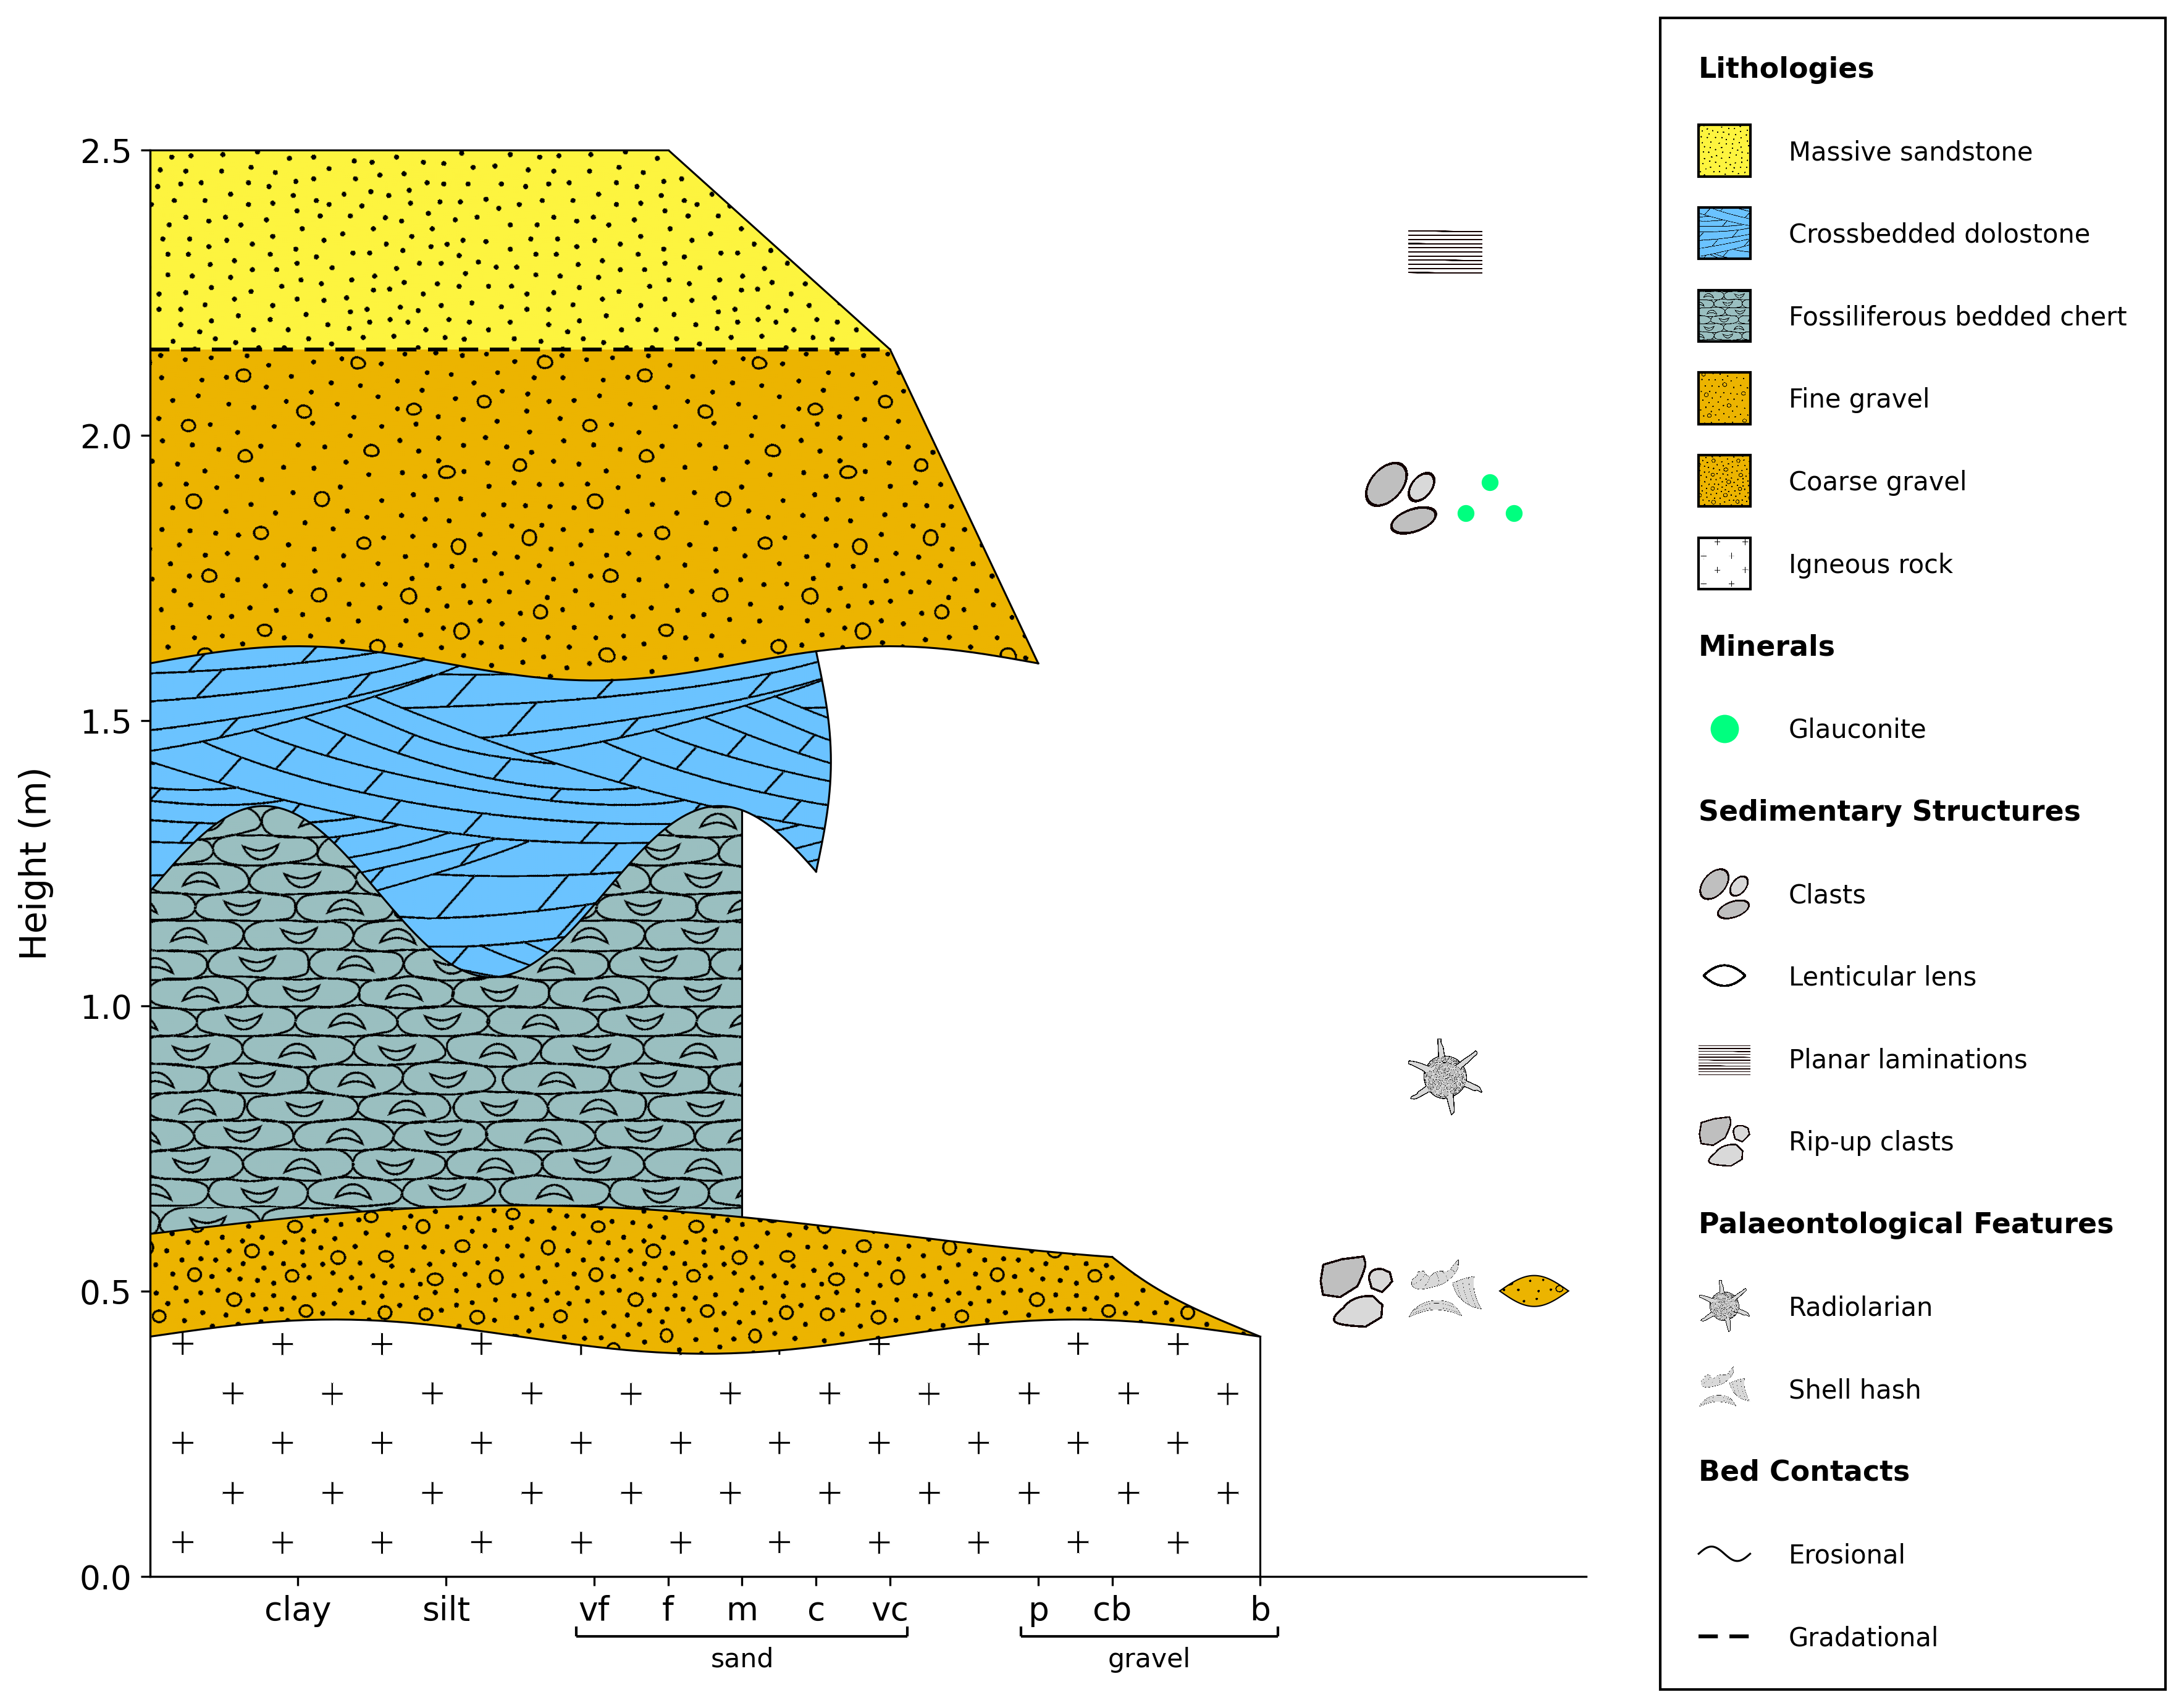
By default, all features, minerals, and lenses are shown in a column on the right-hand side of the log.
import stratapy as sp
log = sp.load('examples.tutorial.csv')

# Default layout (grain size x-axis, filled units)
log.plot()
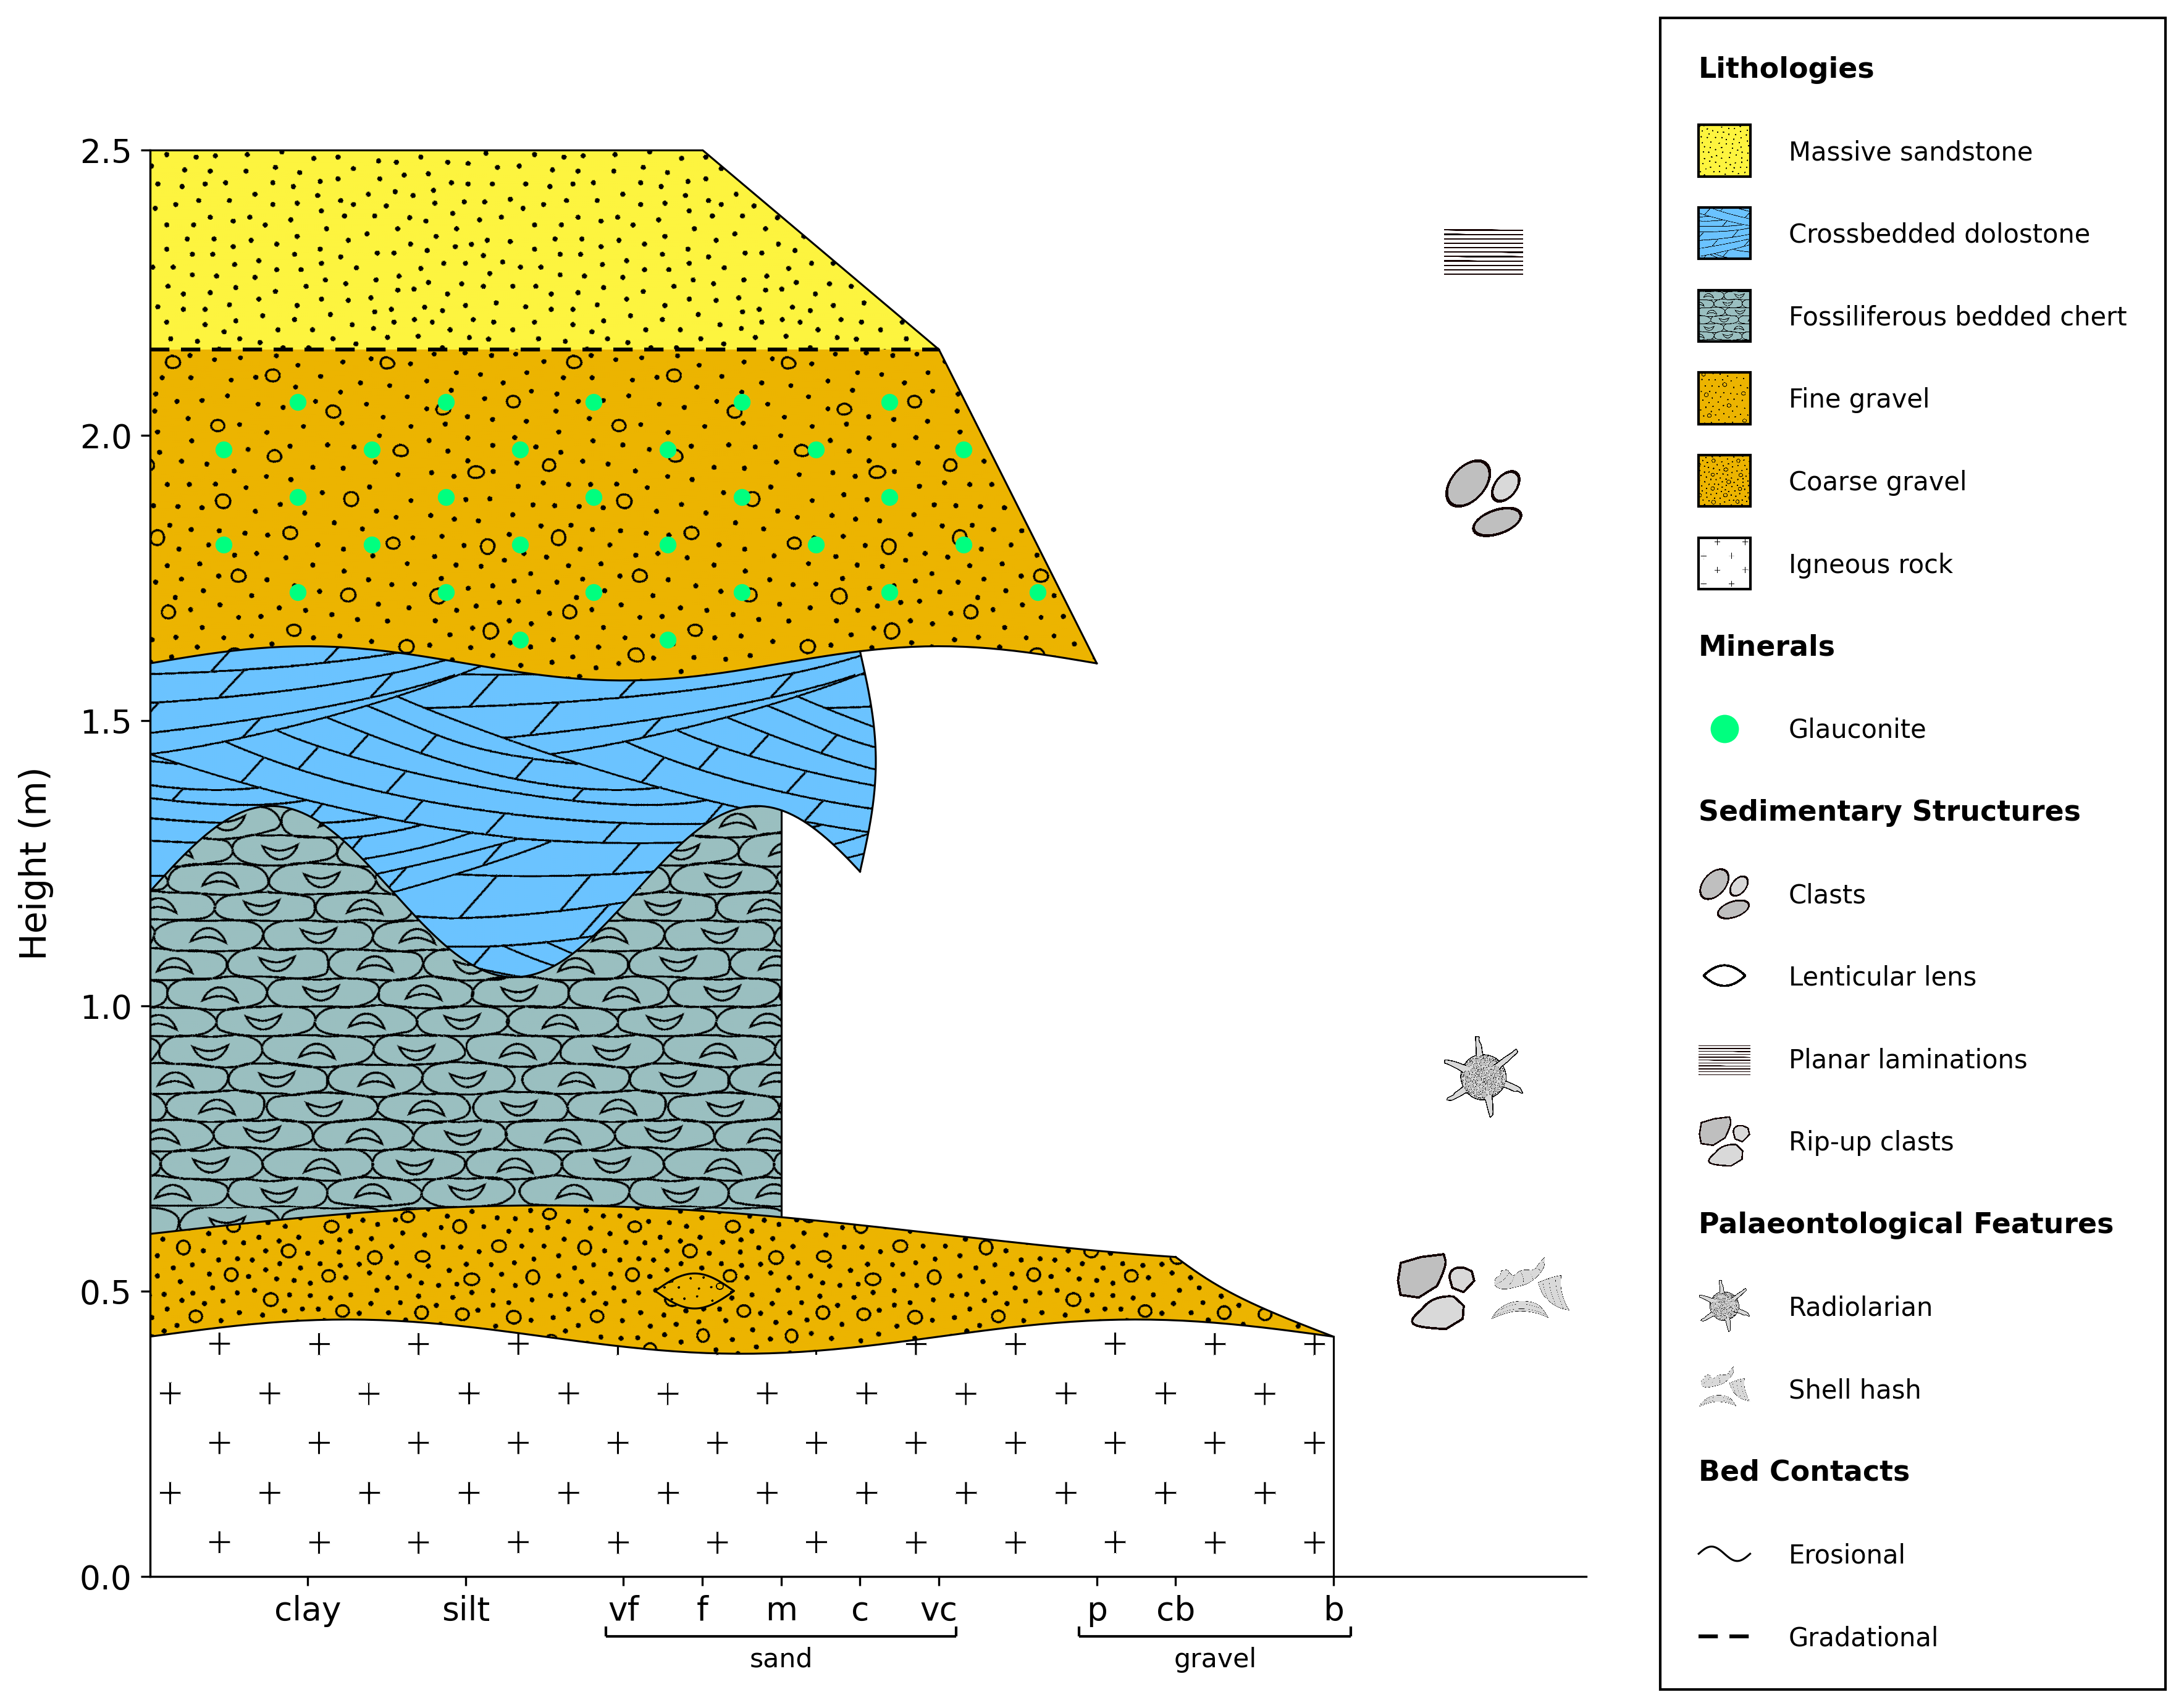
Semi-merge displays minerals and lenses within their respective units, while features remain in the right-hand column.
import stratapy as sp
log = sp.load('examples.tutorial.csv')

# Semi-merge layout (features in column, minerals and lenses within units)
log.plot(feature_mode='semi-merge')
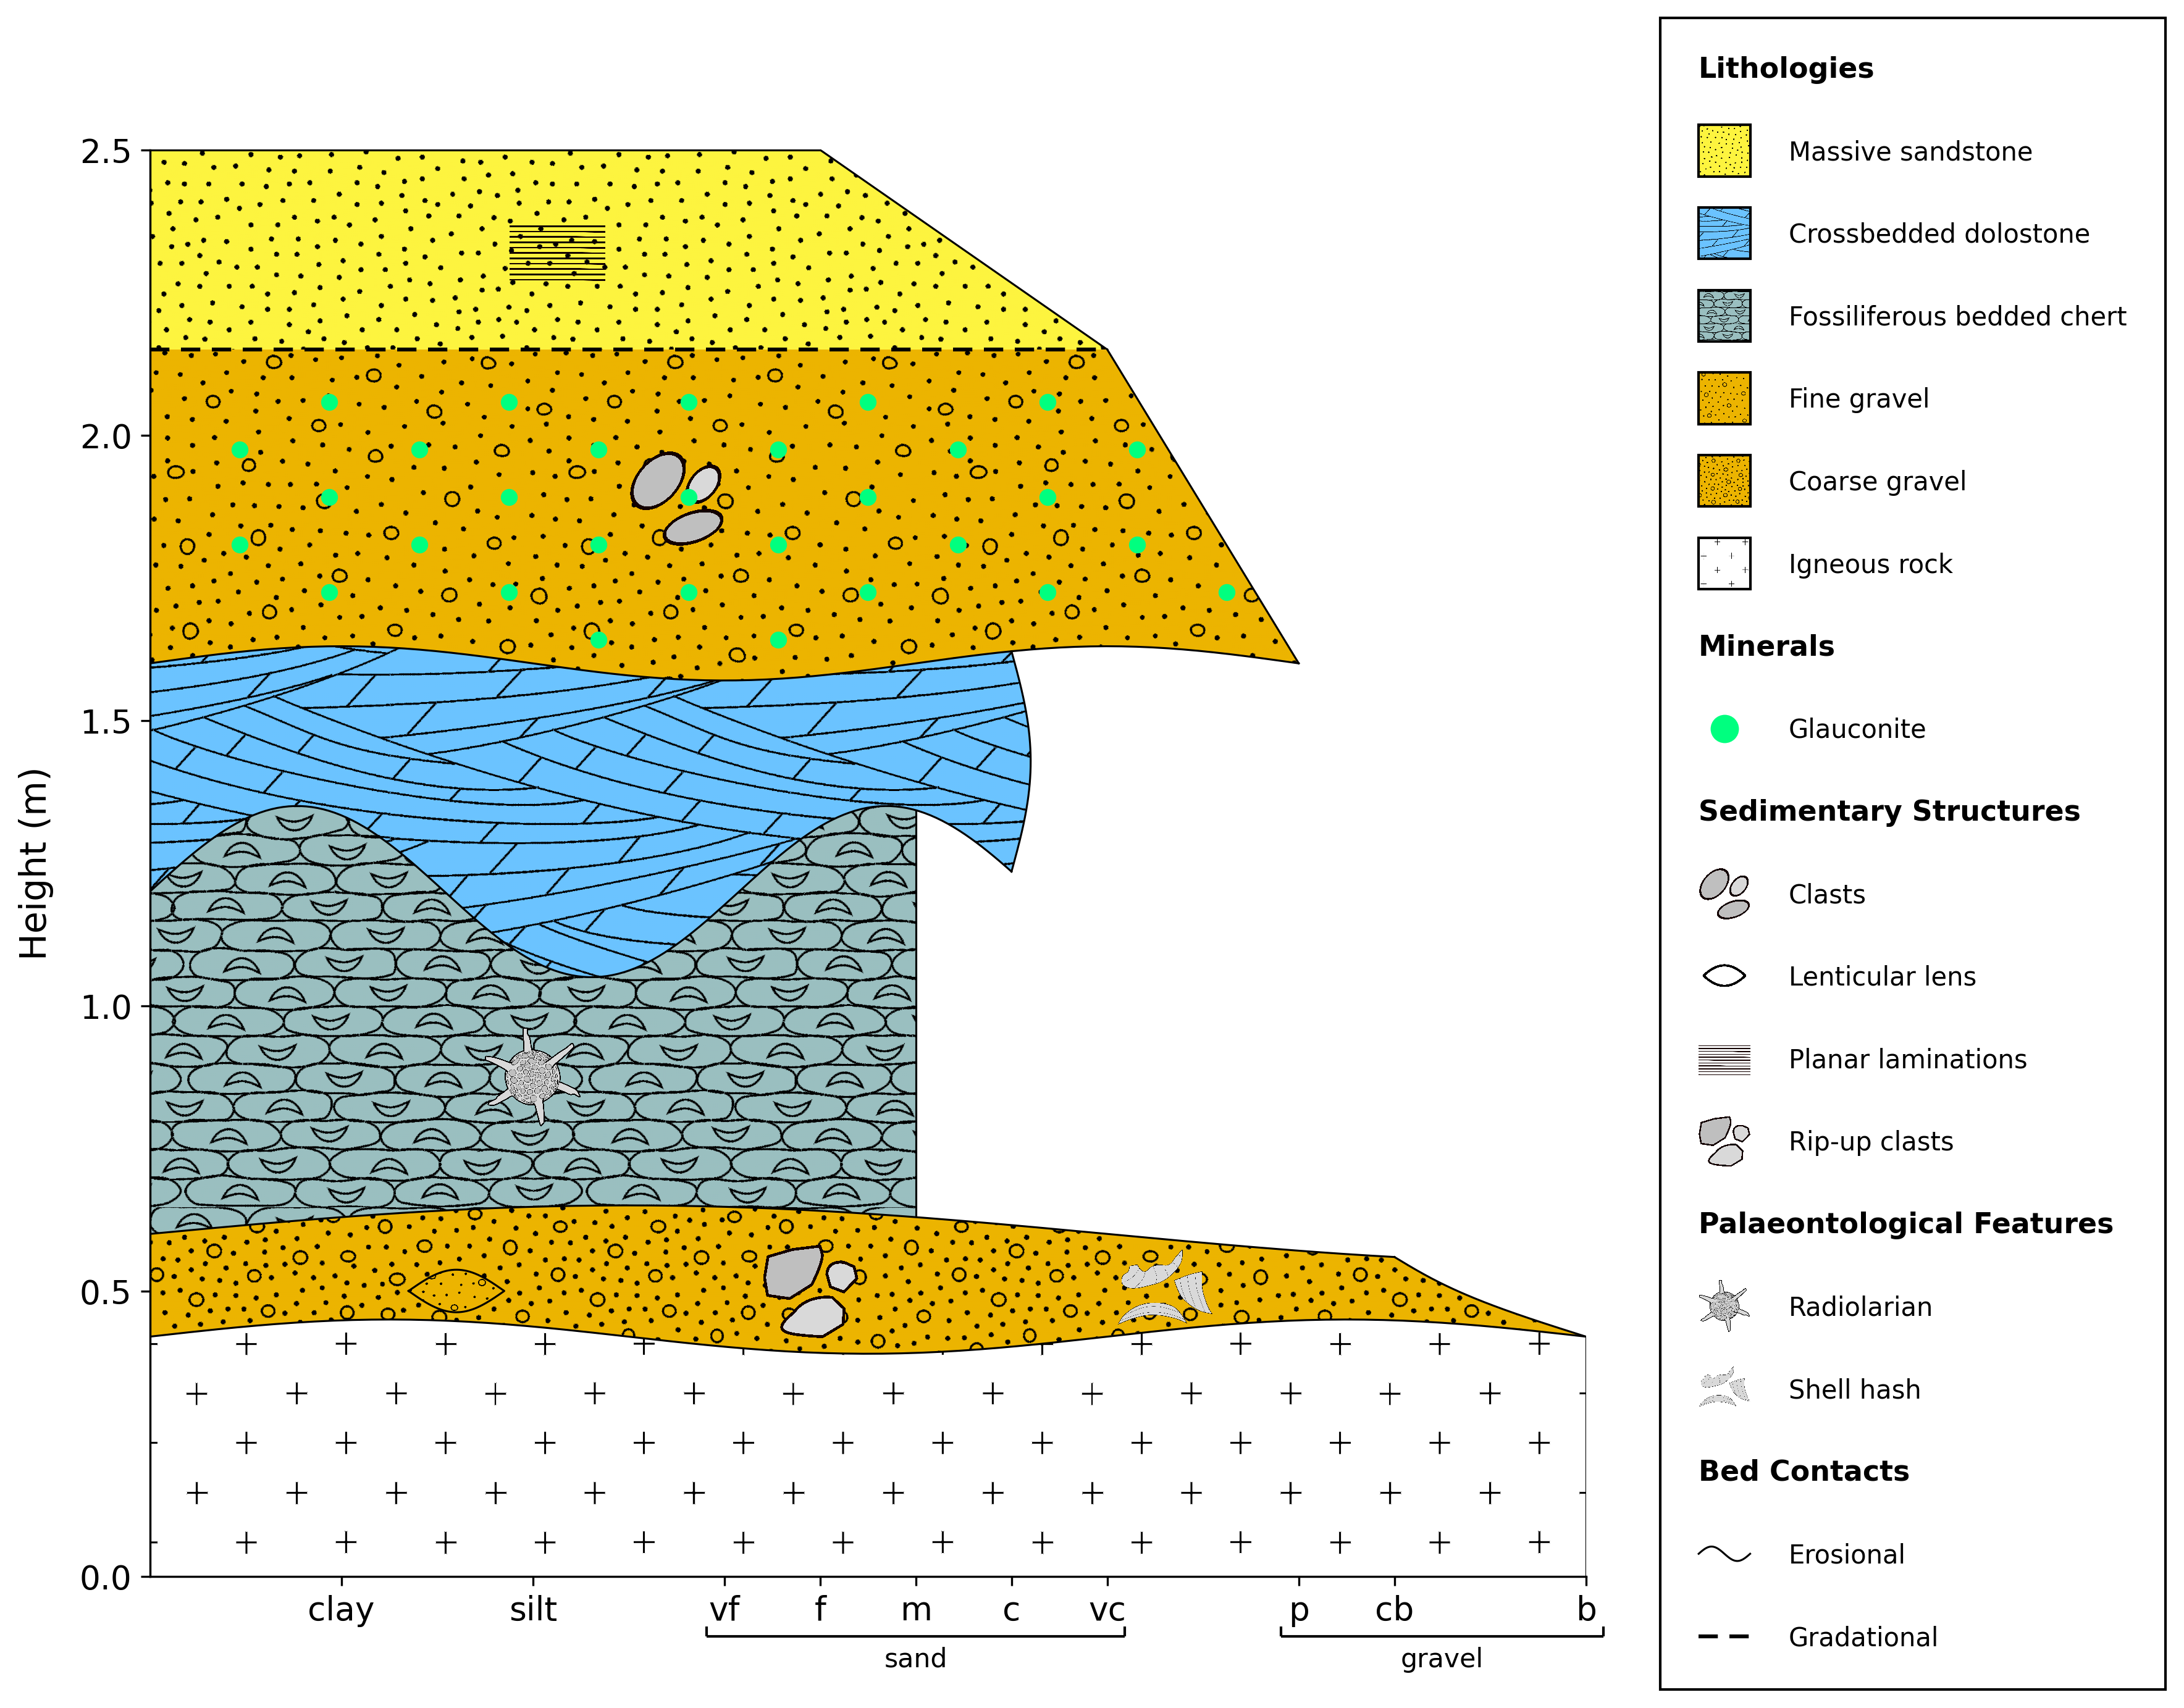
Like semi-merge, but features are also displayed within their respective units.
import stratapy as sp
log = sp.load('examples.tutorial.csv')

# Merge layout (all features, minerals, and lenses within units)
log.plot(feature_mode='merge')
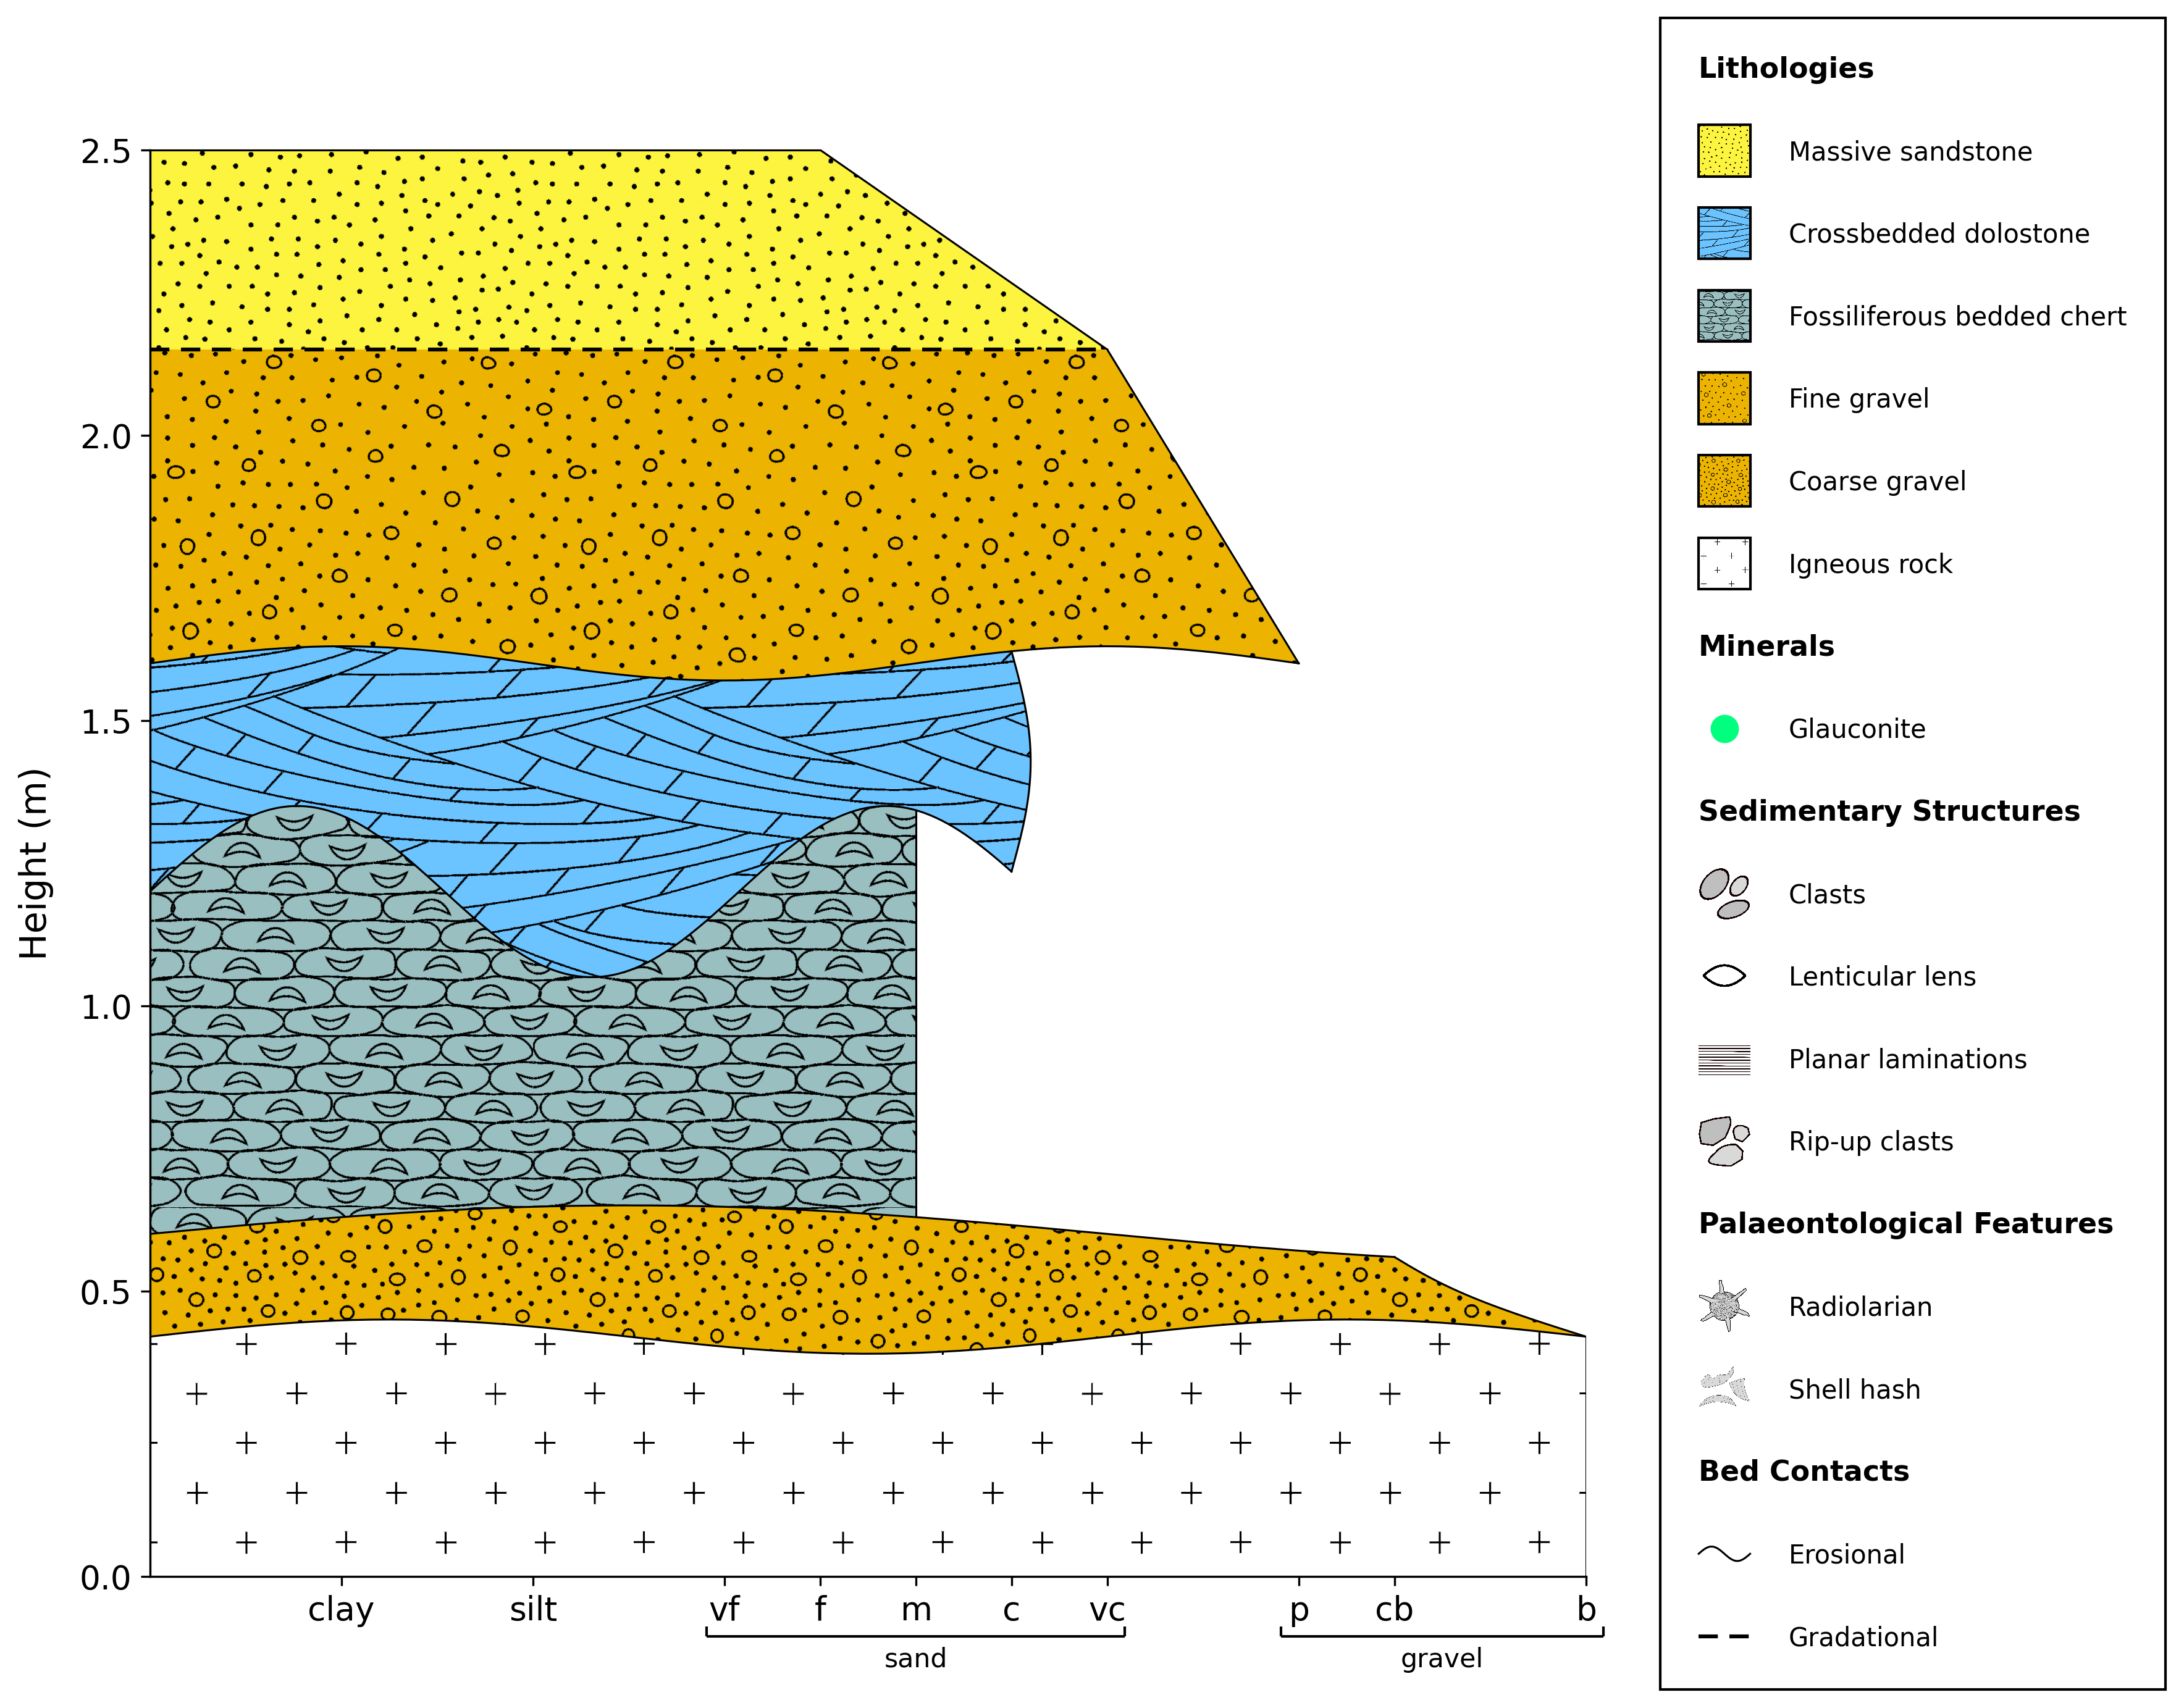
This will prevent all features, minerals, and lenses from being displayed in the log, but will still display them in the legend. This may be useful if you want to manually place such features after plotting. To completely remove them from the log and legend, remove the relevant columns from the input file.
import stratapy as sp
log = sp.load('examples.tutorial.csv')

# No features, minerals, or lenses displayed
log.plot(feature_mode='off')
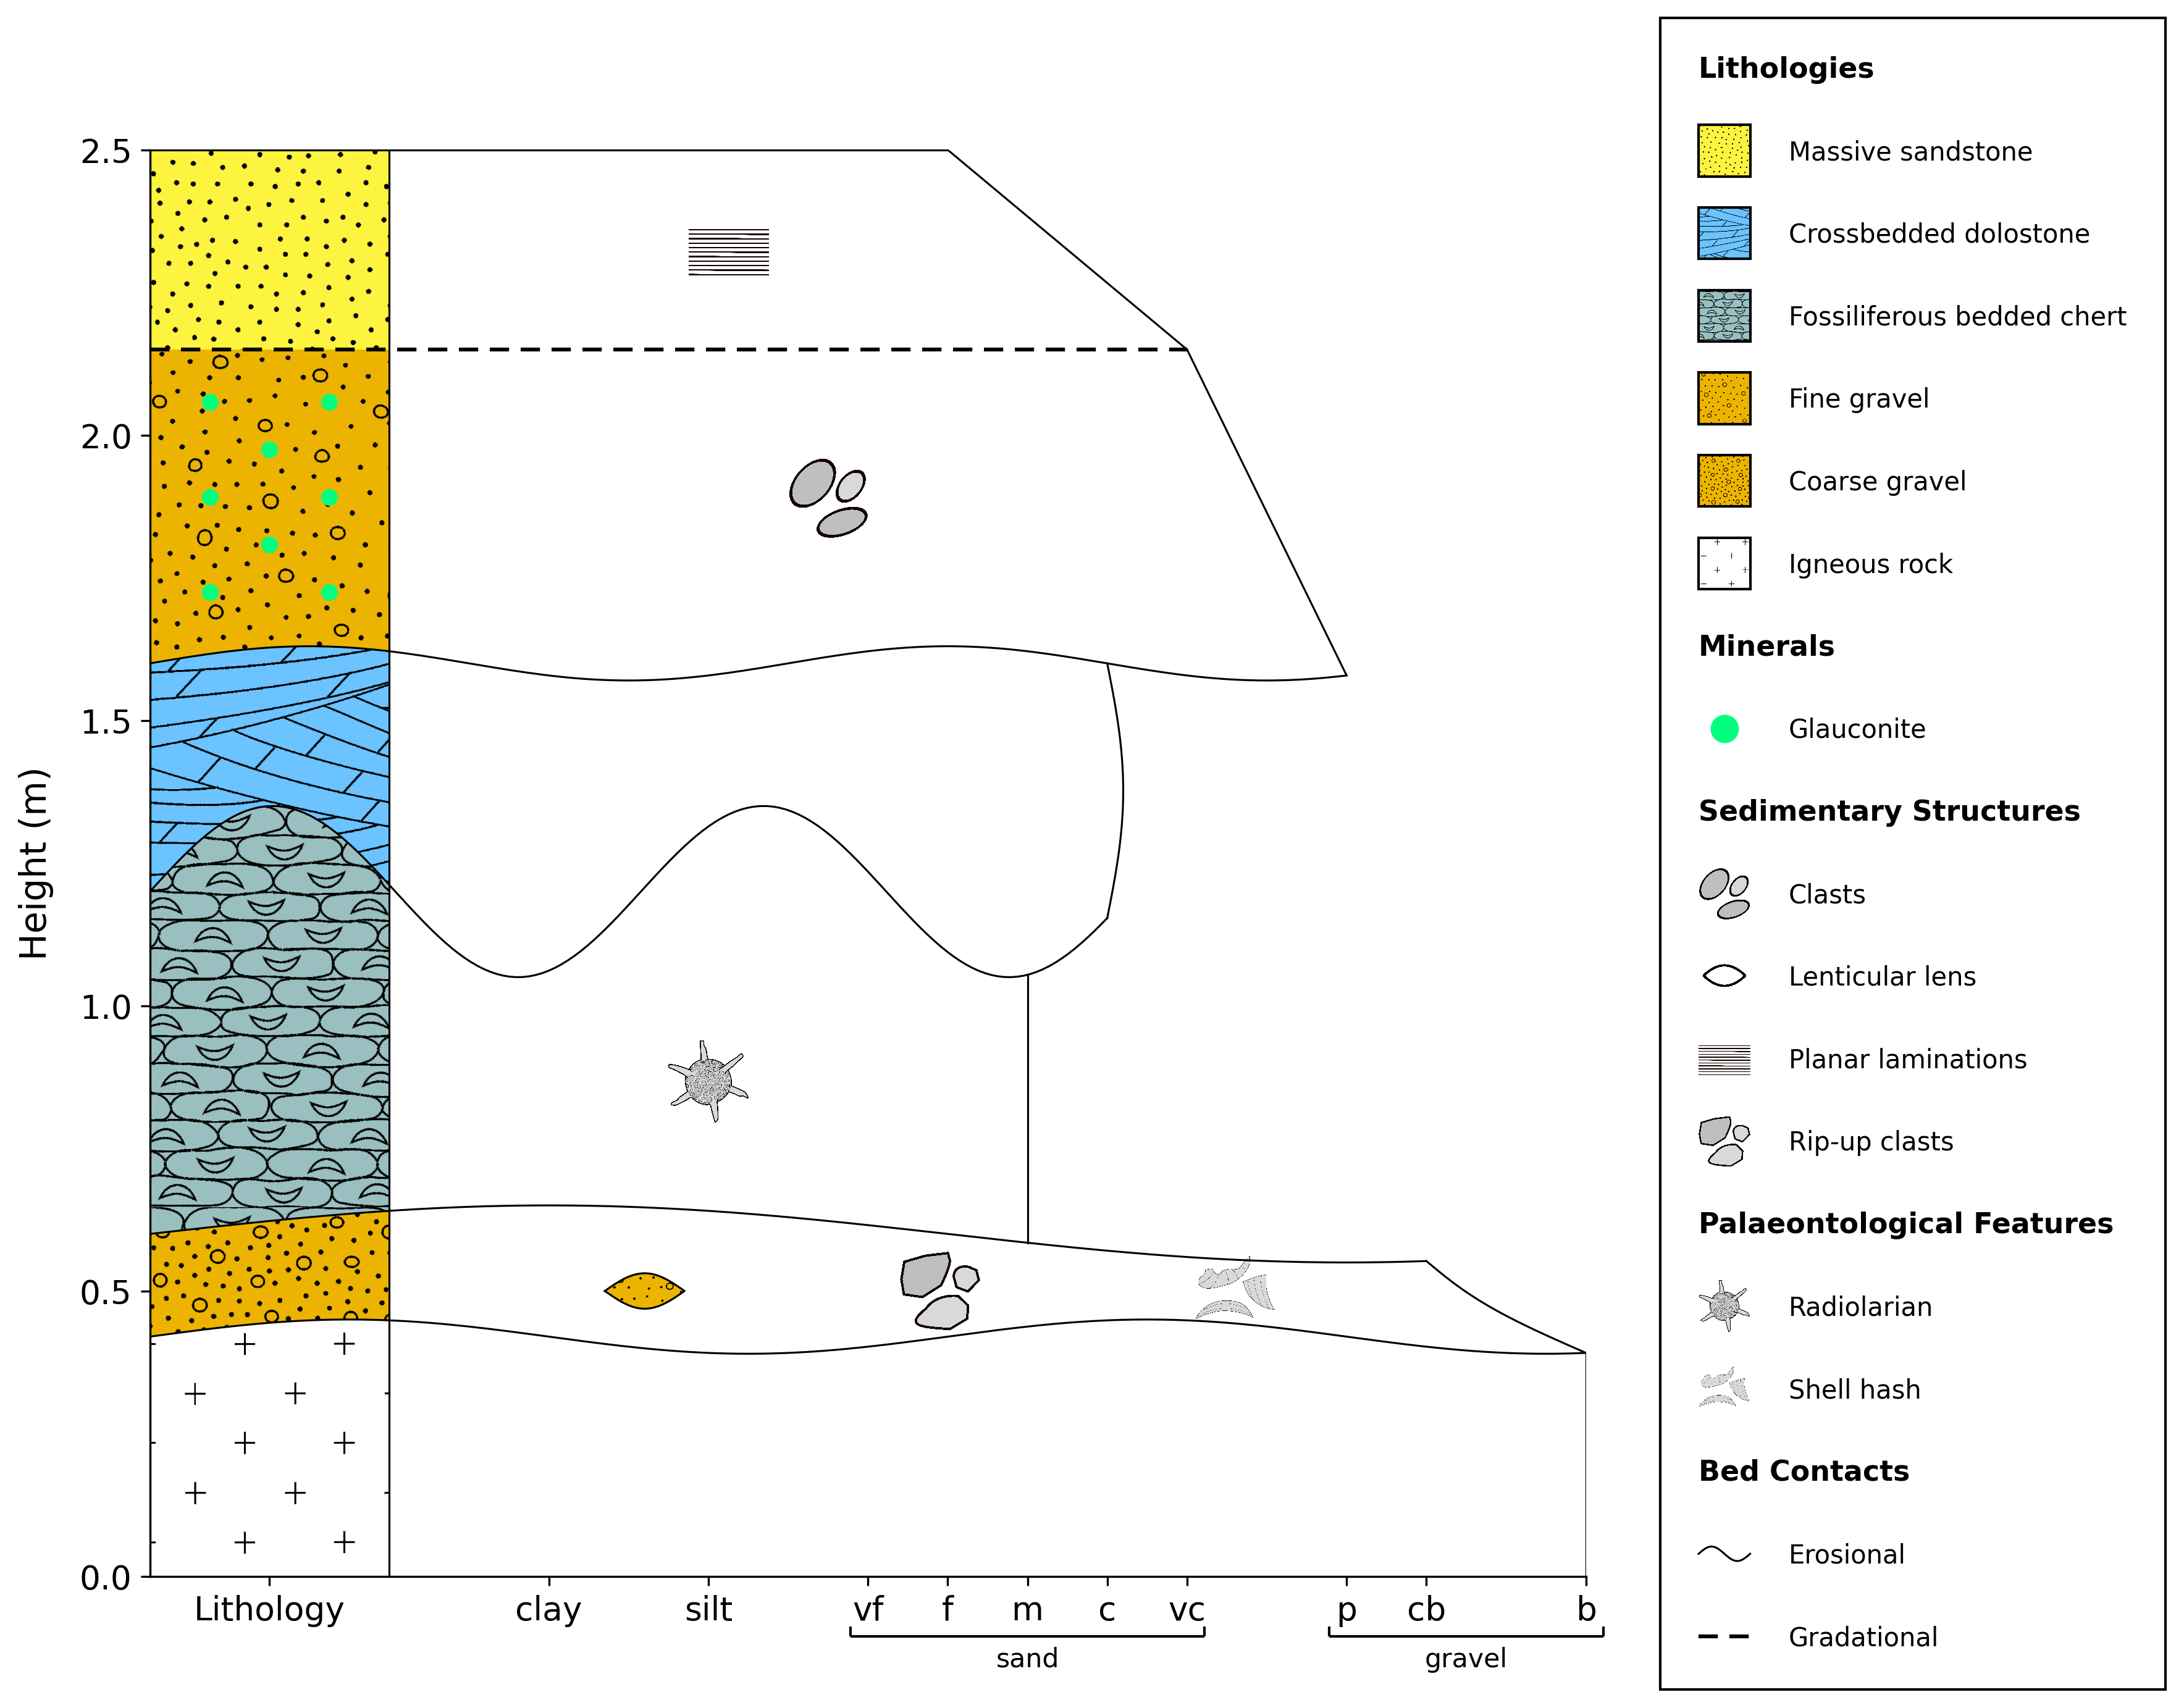
stratapy’s customisation parameters can be combined; for example, to create a log with a grainsize layout and semi-merged minerals and lenses, the following code can be used:
import stratapy as sp
log = sp.load('examples.tutorial.csv')

log.plot(display_mode='grainsize', feature_mode='merge')
The next section, Customisation Guide, goes into more detail on all of the customisation parameters available, as well as other customisation options, including figure layout, legends and labels.
It also demonstrates the capabilities to add additional elements to a log, such as automatic addition of chronostratigraphy, labels, sample locations, and more.