Log with Chronostratigraphy
This log shows the Neoproterozoic to Ordovician stratigraphy of southeastern Idaho with accompanying chronostratigraphy [1].
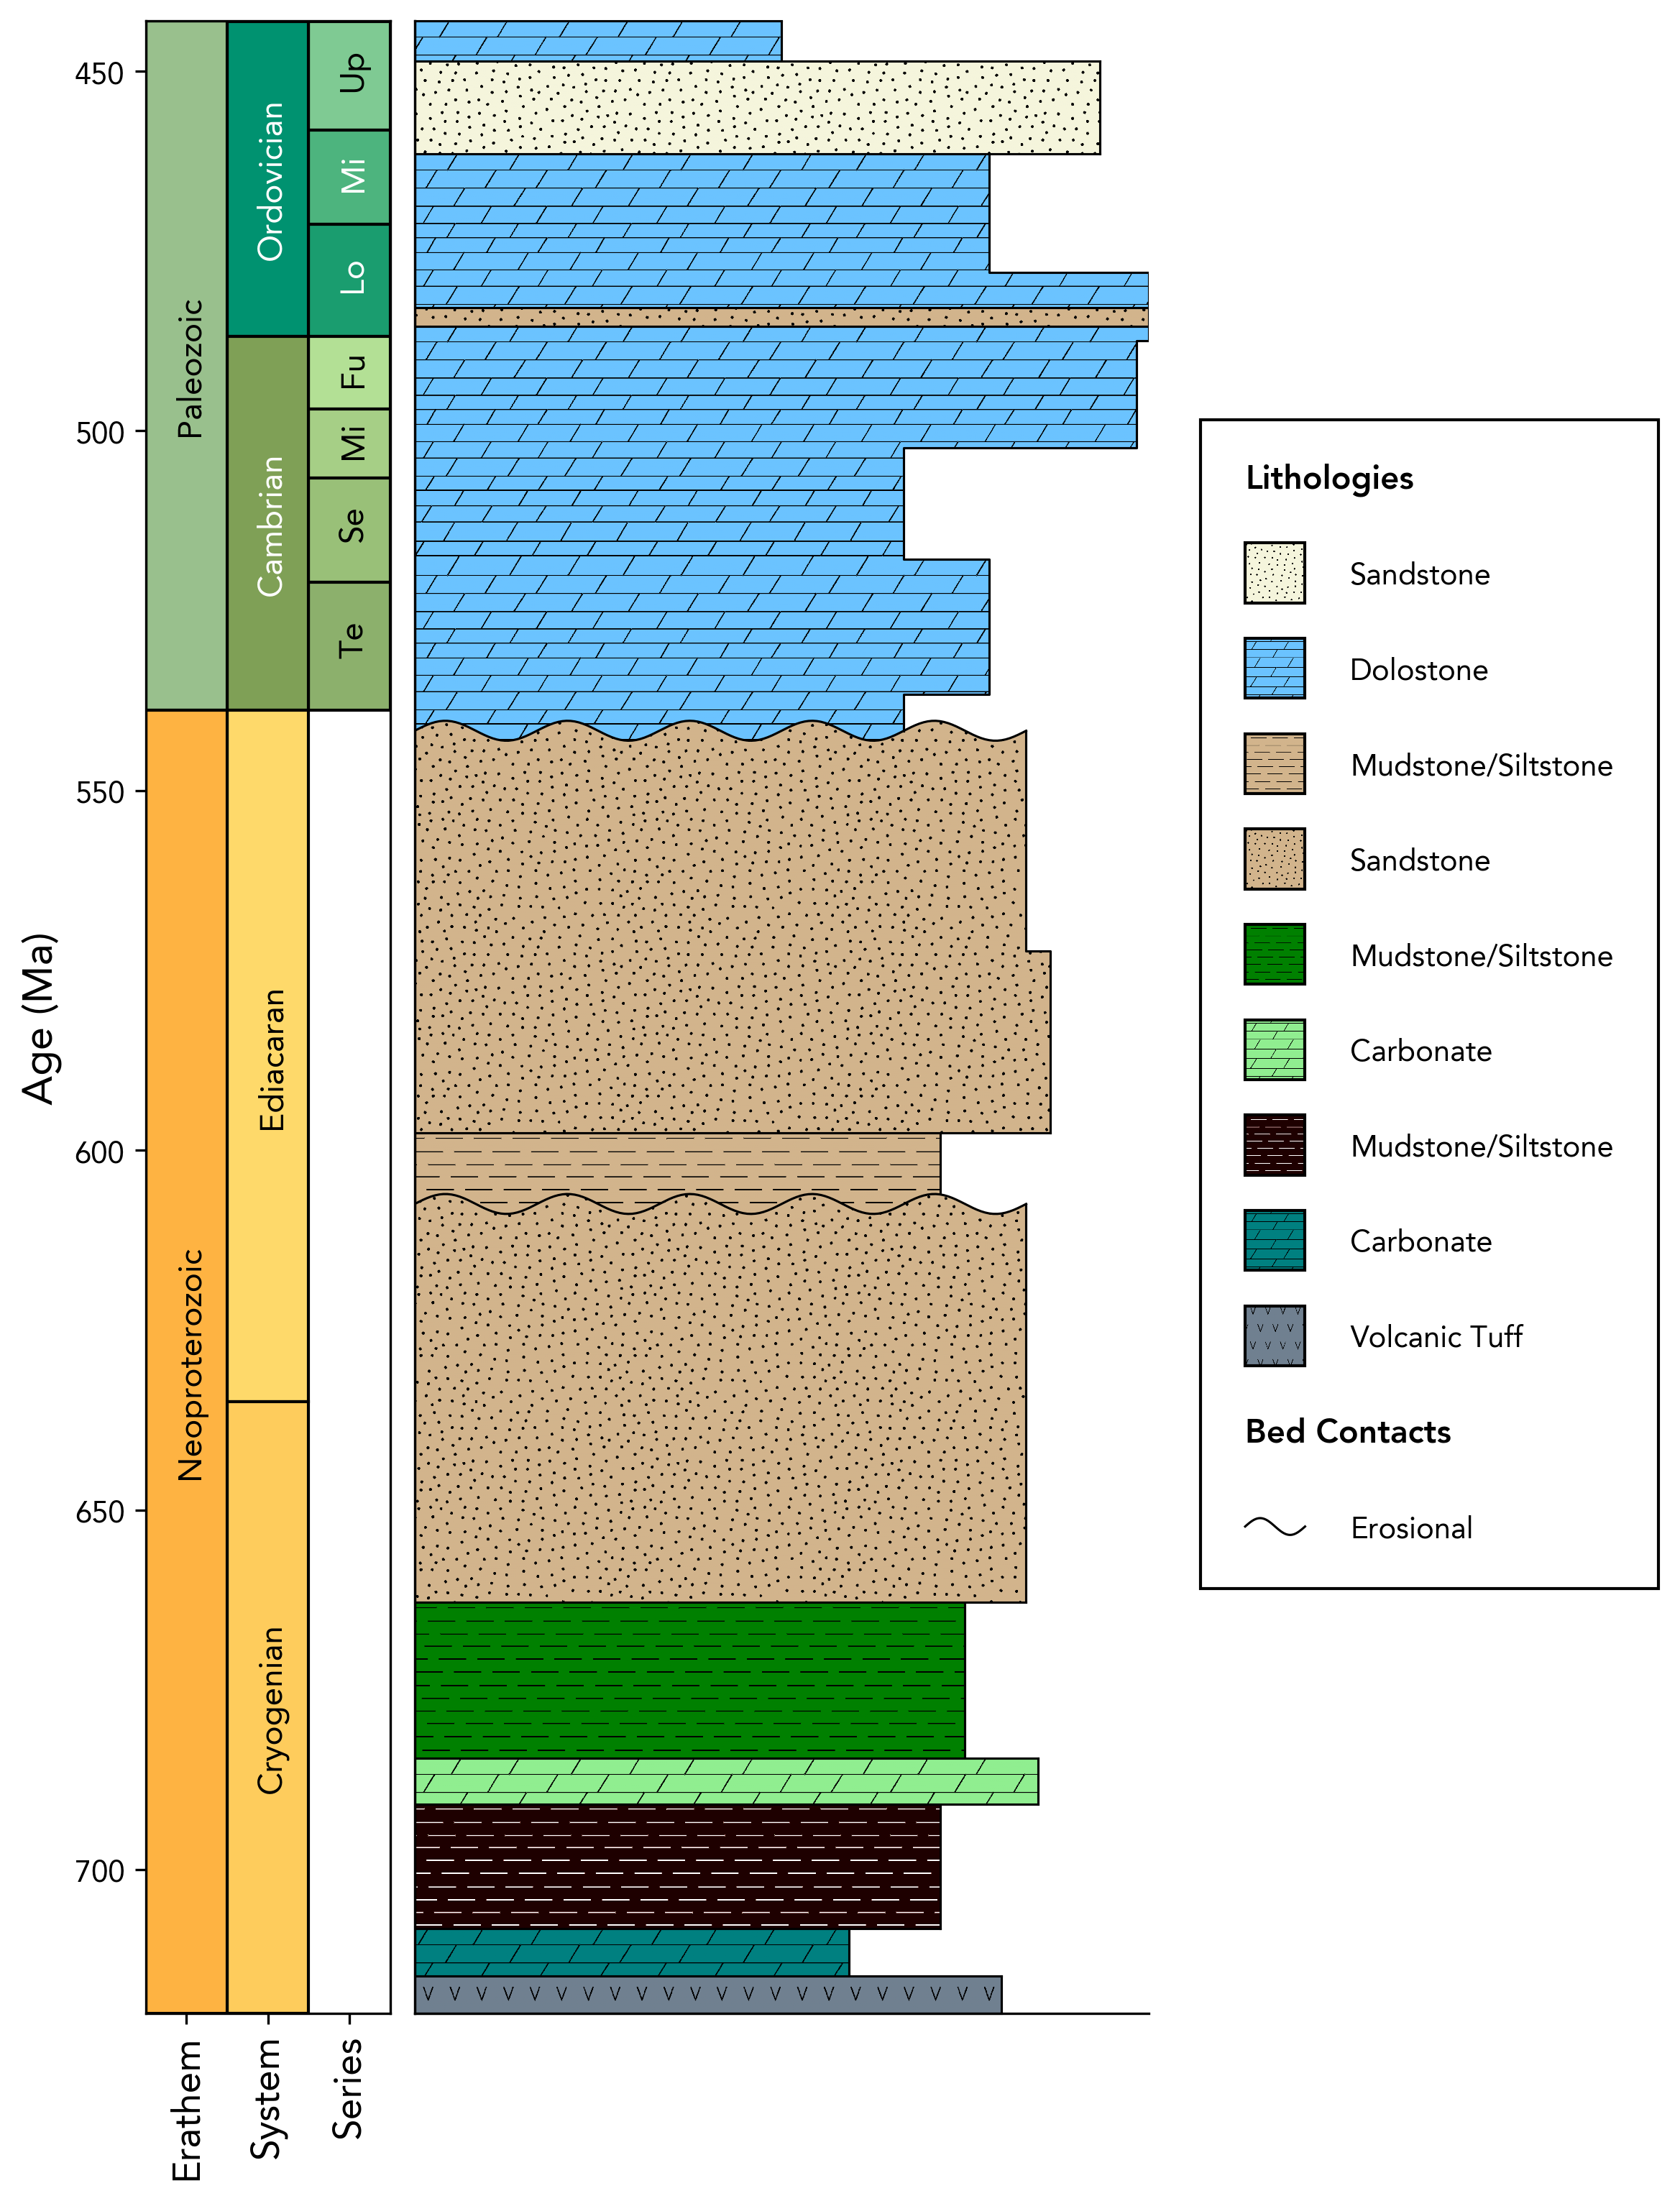
Code to reproduce this figure:
# Update the lithologies
sp.update_lithologies( {
    'blue': ('', '#8f8d85', 'aa'),
    'sandstoneA': ('607', 'beige', 'Sandstone'),
    'sandstoneB': ('607', 'tan', 'Sandstone'),
    'tanline': ('620', 'tan', 'Mudstone/Siltstone'),
    'green': ('620', 'green', 'Mudstone/Siltstone'),
    'lightgreen': ('dolostone', 'lightgreen', 'Carbonate'),
    'pink': ('620', 'pink', 'Mudstone/Siltstone'),
    'teal': ('dolostone', 'teal', 'Carbonate'),
    'grey': ('vitrophyre', 'slategrey', 'Volcanic Tuff'),
} )

# Create a figure for to control the layout explicitly
fig, ax = plt.subplots(1, 2, figsize=(6, 12), gridspec_kw={'width_ratios': [0.25, 0.75], 'wspace': 0.05})

# Load and plot the log
log = sp.load('examples.Brennan_2020.csv', grain_brackets={})
log.plot(fig=fig, ax=ax[1], figsize=(2,12), ppi=800, dpi=300)

# Add chronostratigraphy between a fixed range
sp.chronostratigraphy(lower_age=443, upper_age=720, ranks_to_display=[2,3,4], fig=fig, ax=ax[0])
ax[1].set_xticks([])
ax[1].set_yticks([])
ax[1].set_ylabel('')
Data used to generate this figure:
This file is built into stratapy, the code above will work without any need to download or specify file paths.
References
Brennan, D. M. Pearson, P. K. Link, & K. R. Chamberlain. Neoproterozoic Windermere Supergroup near Bayhorse, Idaho: Late‐stage Rodinian rifting was deflected west around the Belt basin. Tectonics 39 8 (2020) DOI.