Log Layout
stratapy offers three different log layouts to suit different needs:
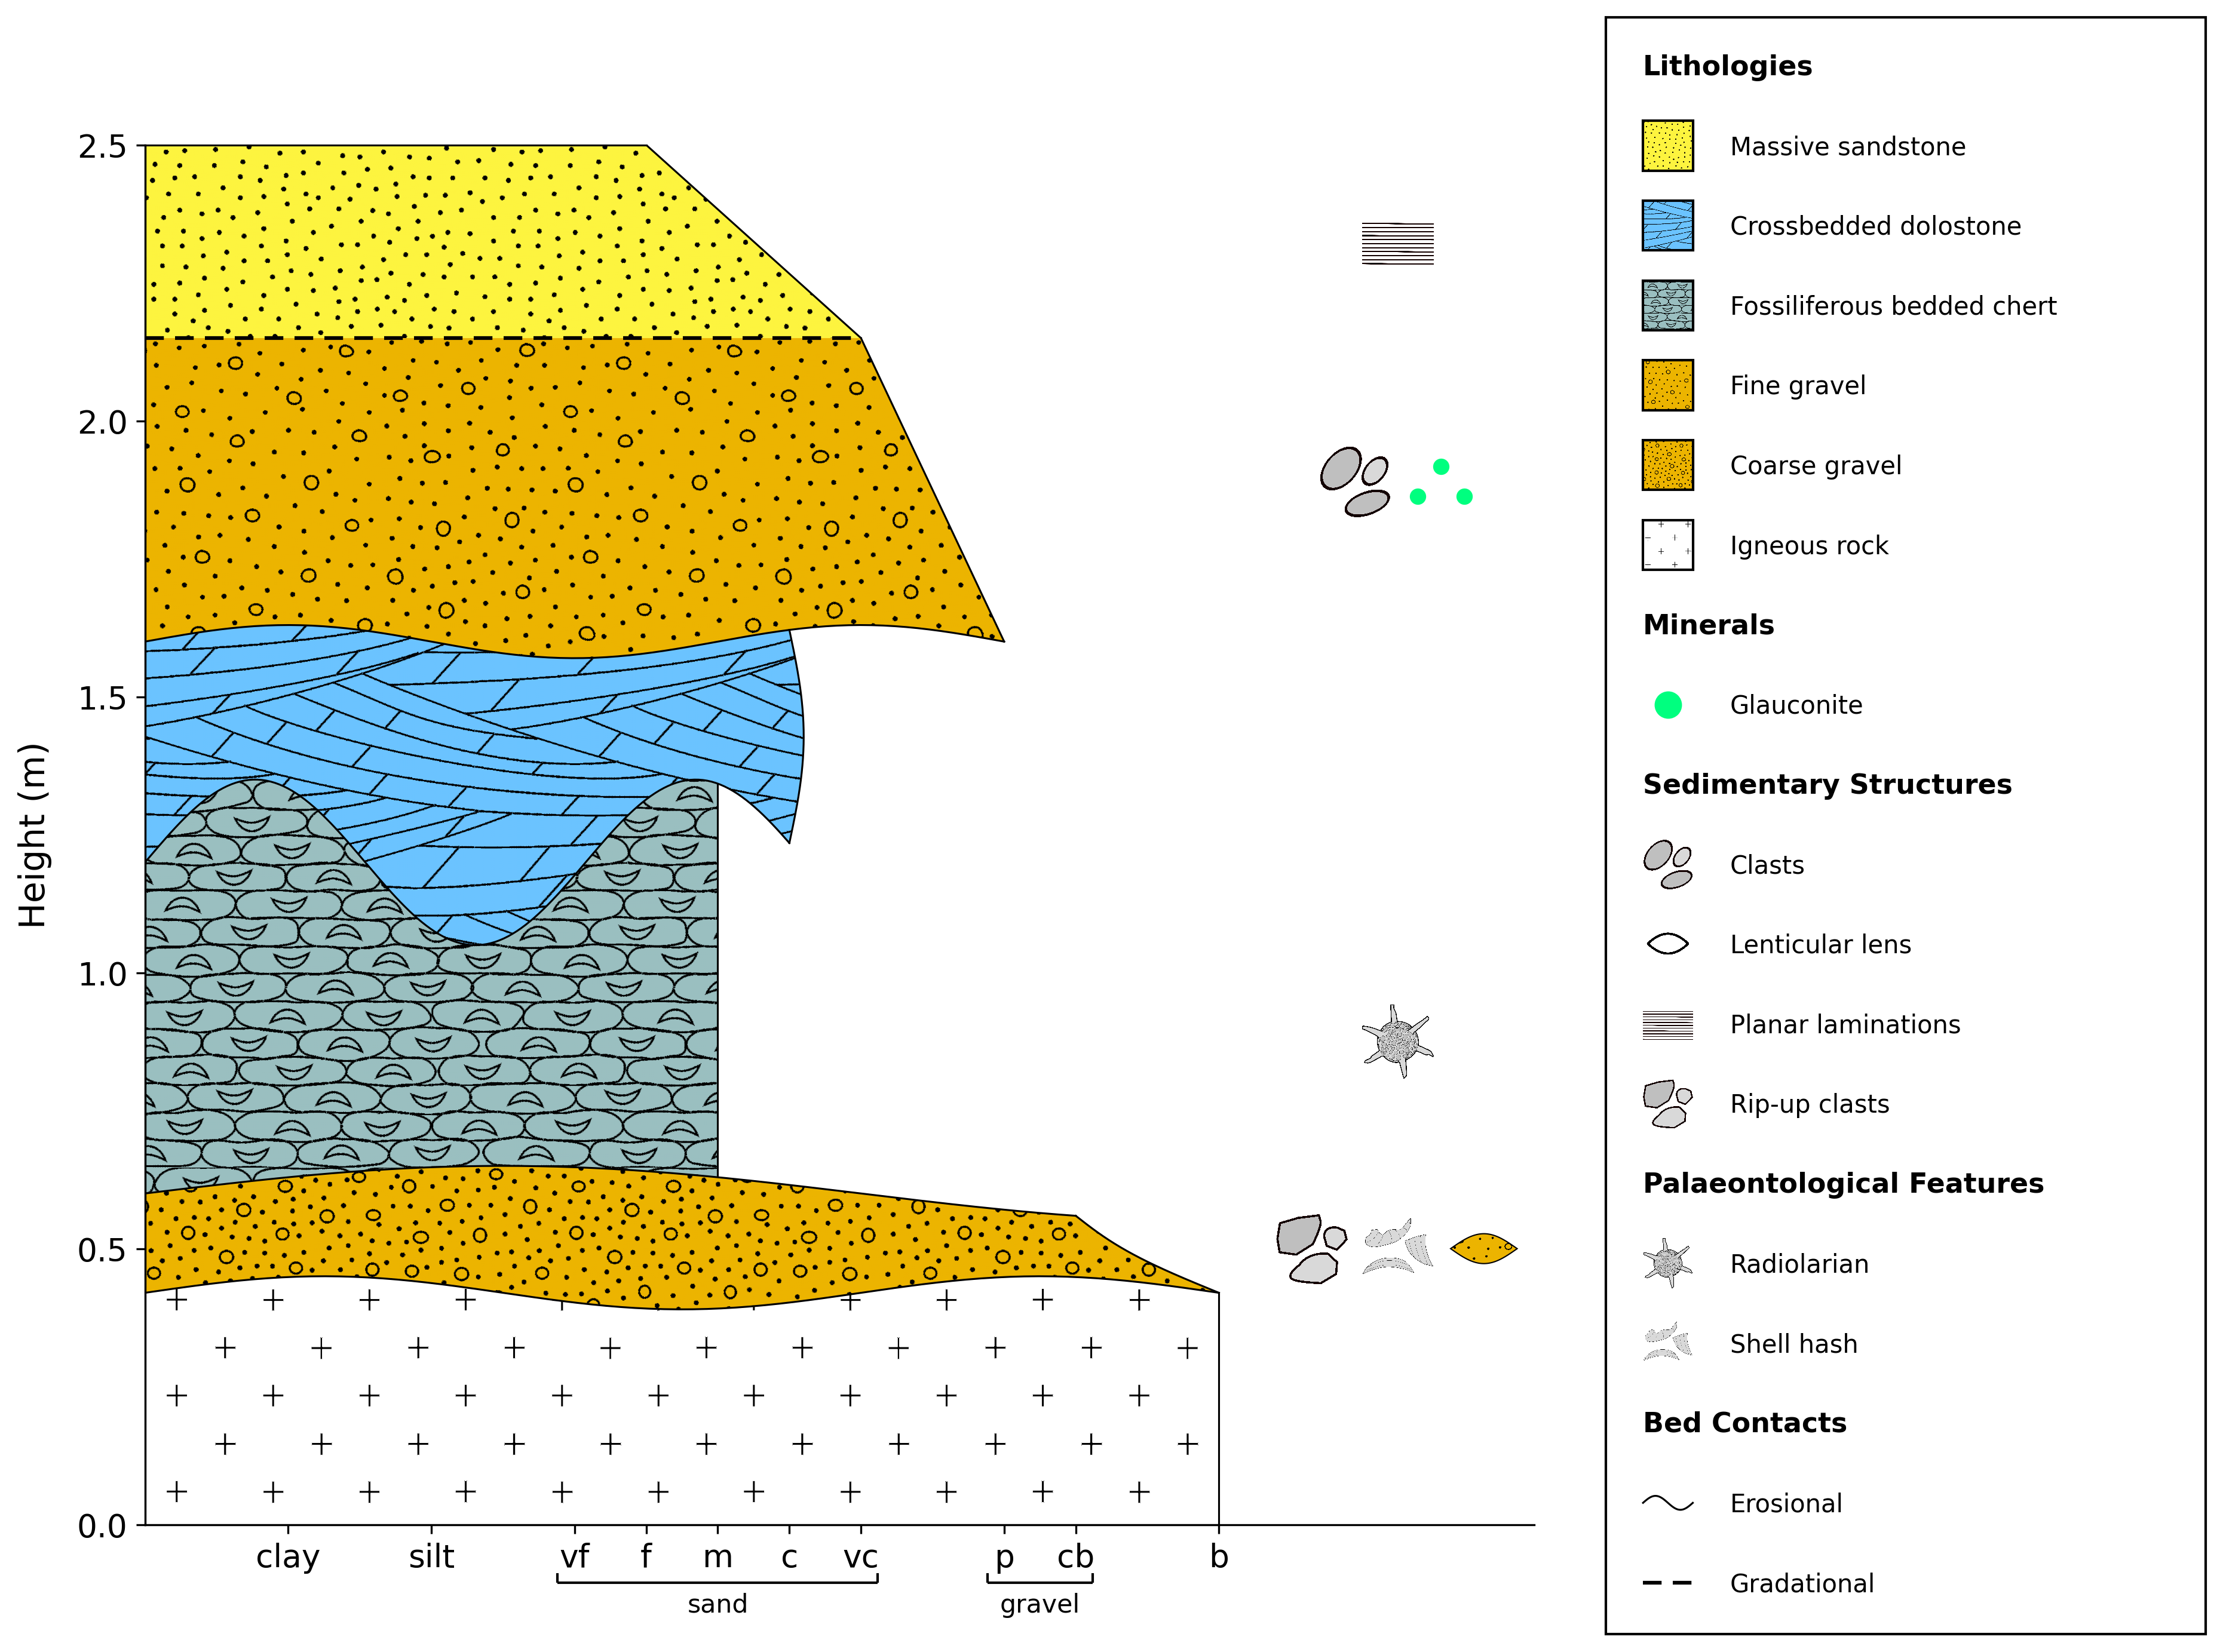
By default, units are shown with a grain size x-axis, as defined in the input file, and lithological patterns fill the entire unit.
import stratapy as sp
log = sp.load('examples.tutorial.csv')

# Default layout (grain size x-axis, filled units)
log.plot()
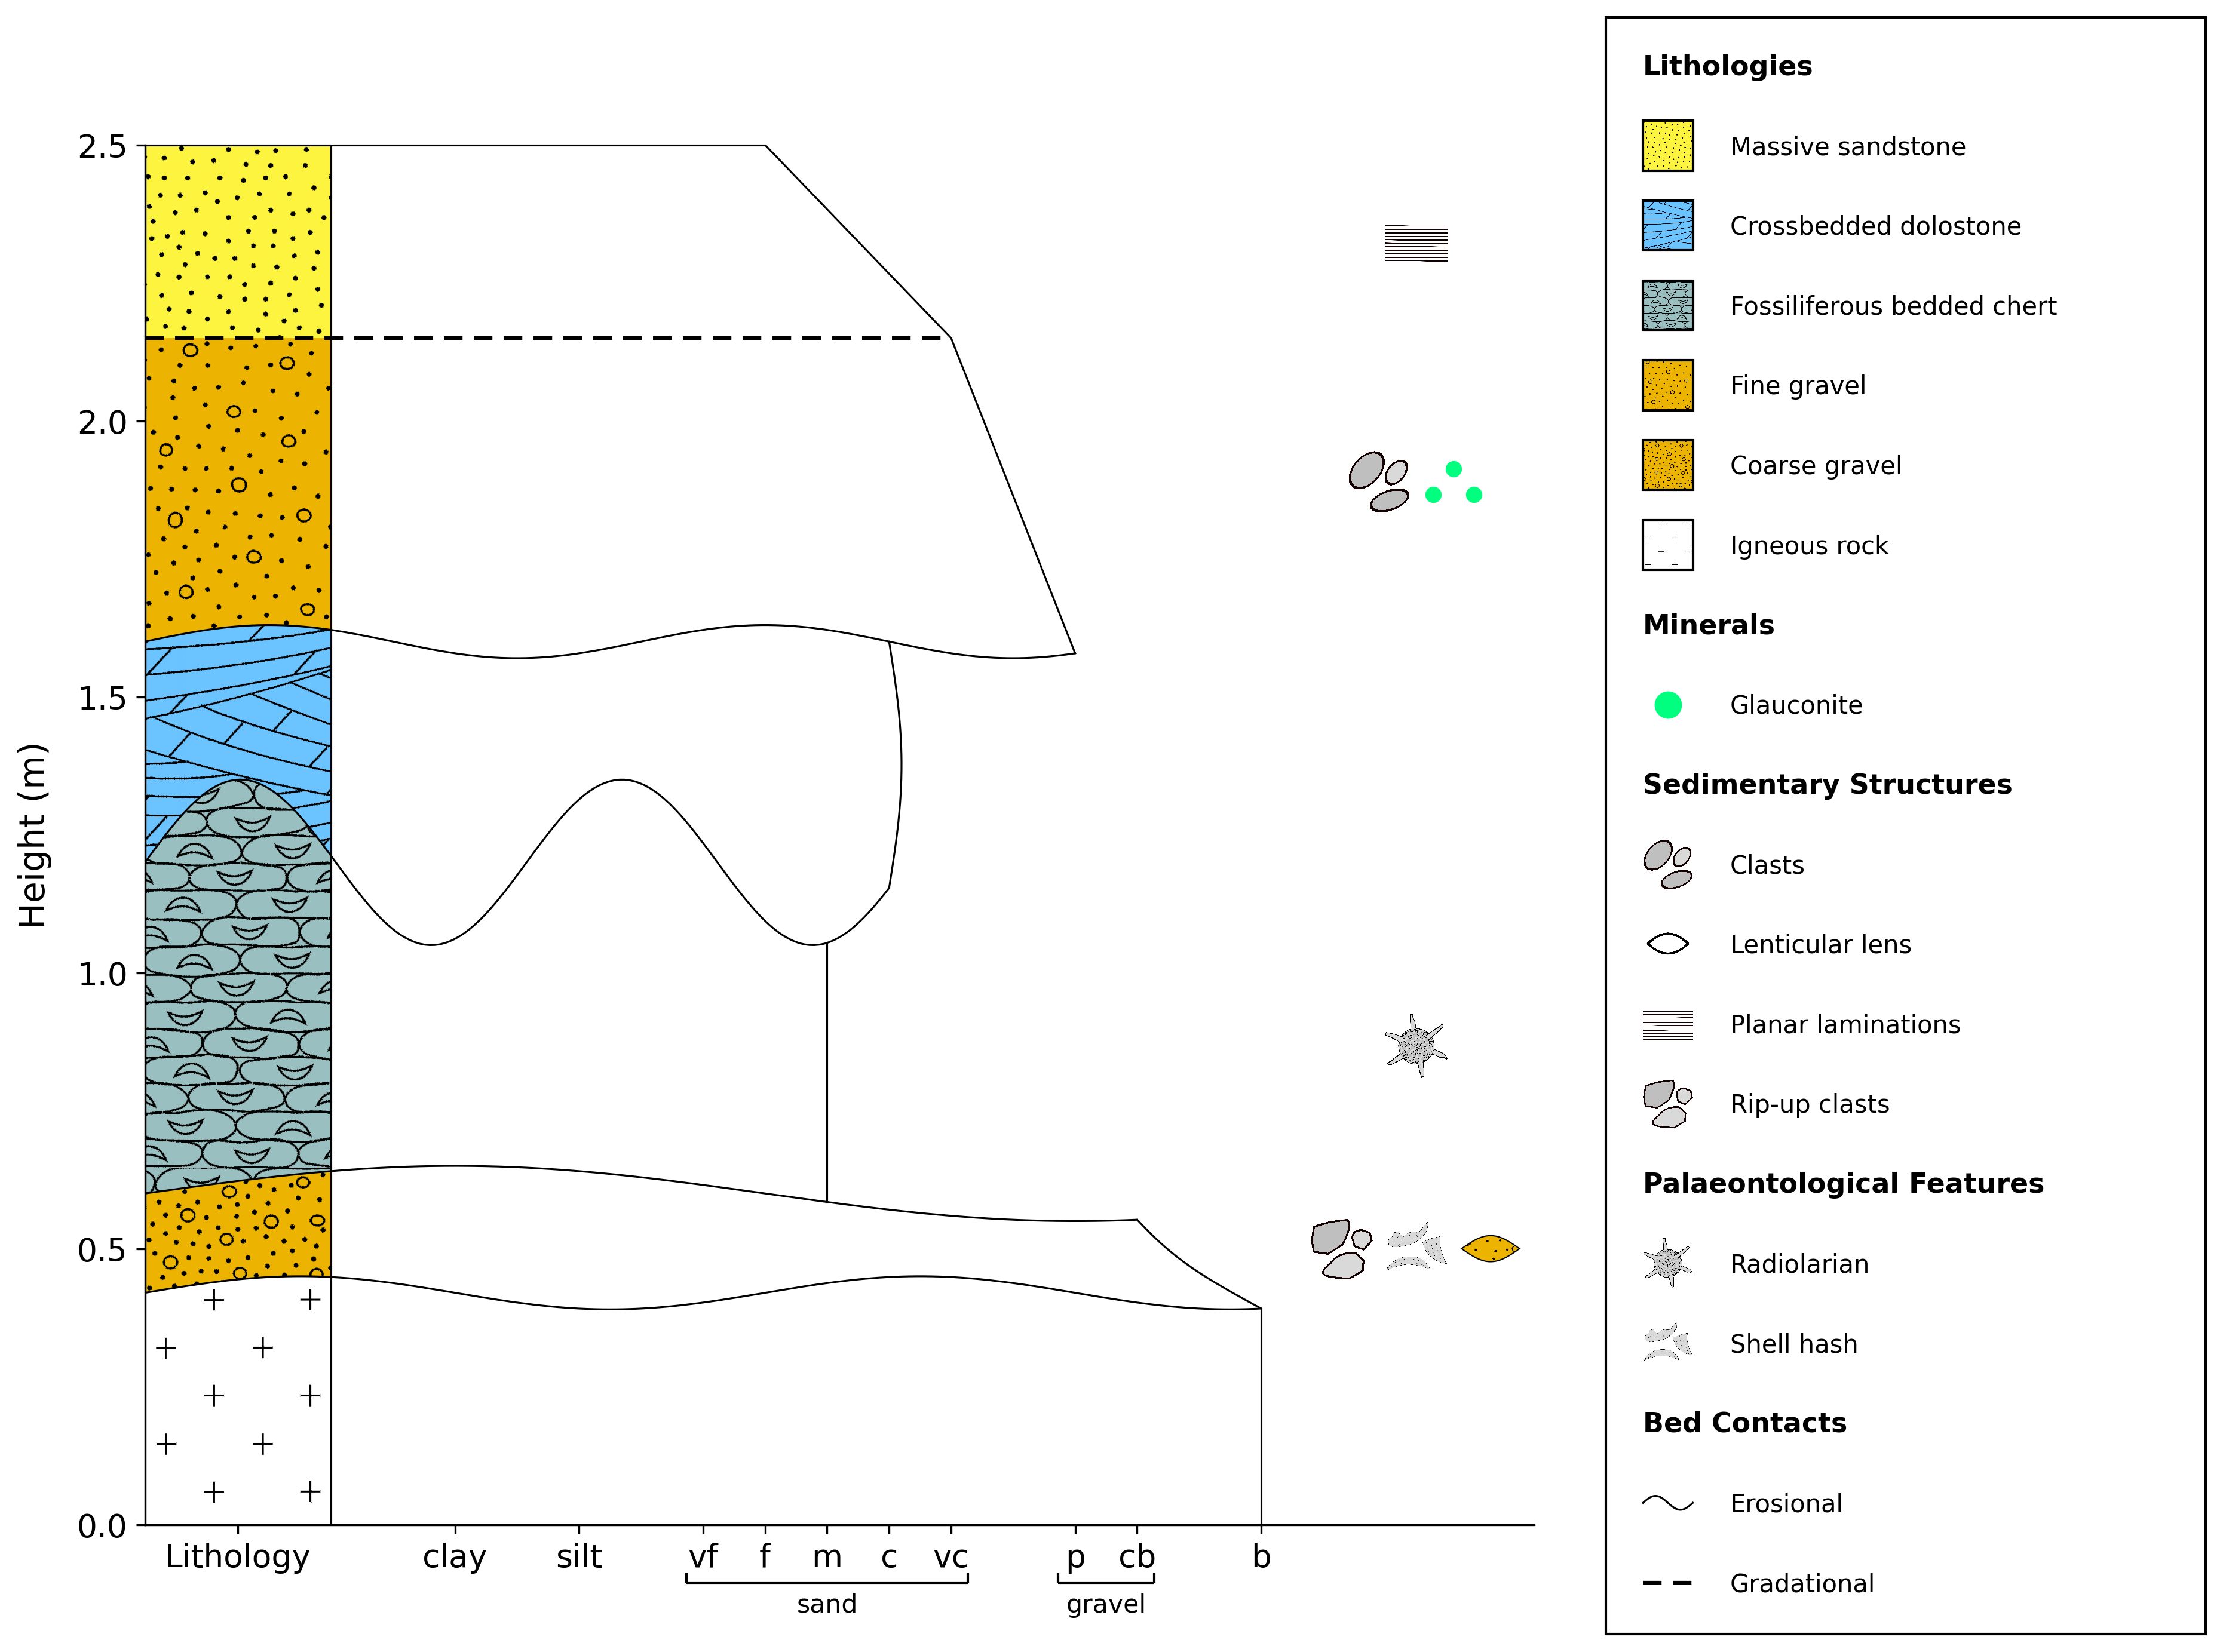
Grainsize mode is similar to the default layout but units are not filled, instead having a single lithology column on the left-hand side, filled with lithological patterns.
import stratapy as sp
log = sp.load('examples.tutorial.csv')

# Grainsize layout (grain size x-axis, lithology column)
log.plot(display_mode='grainsize')
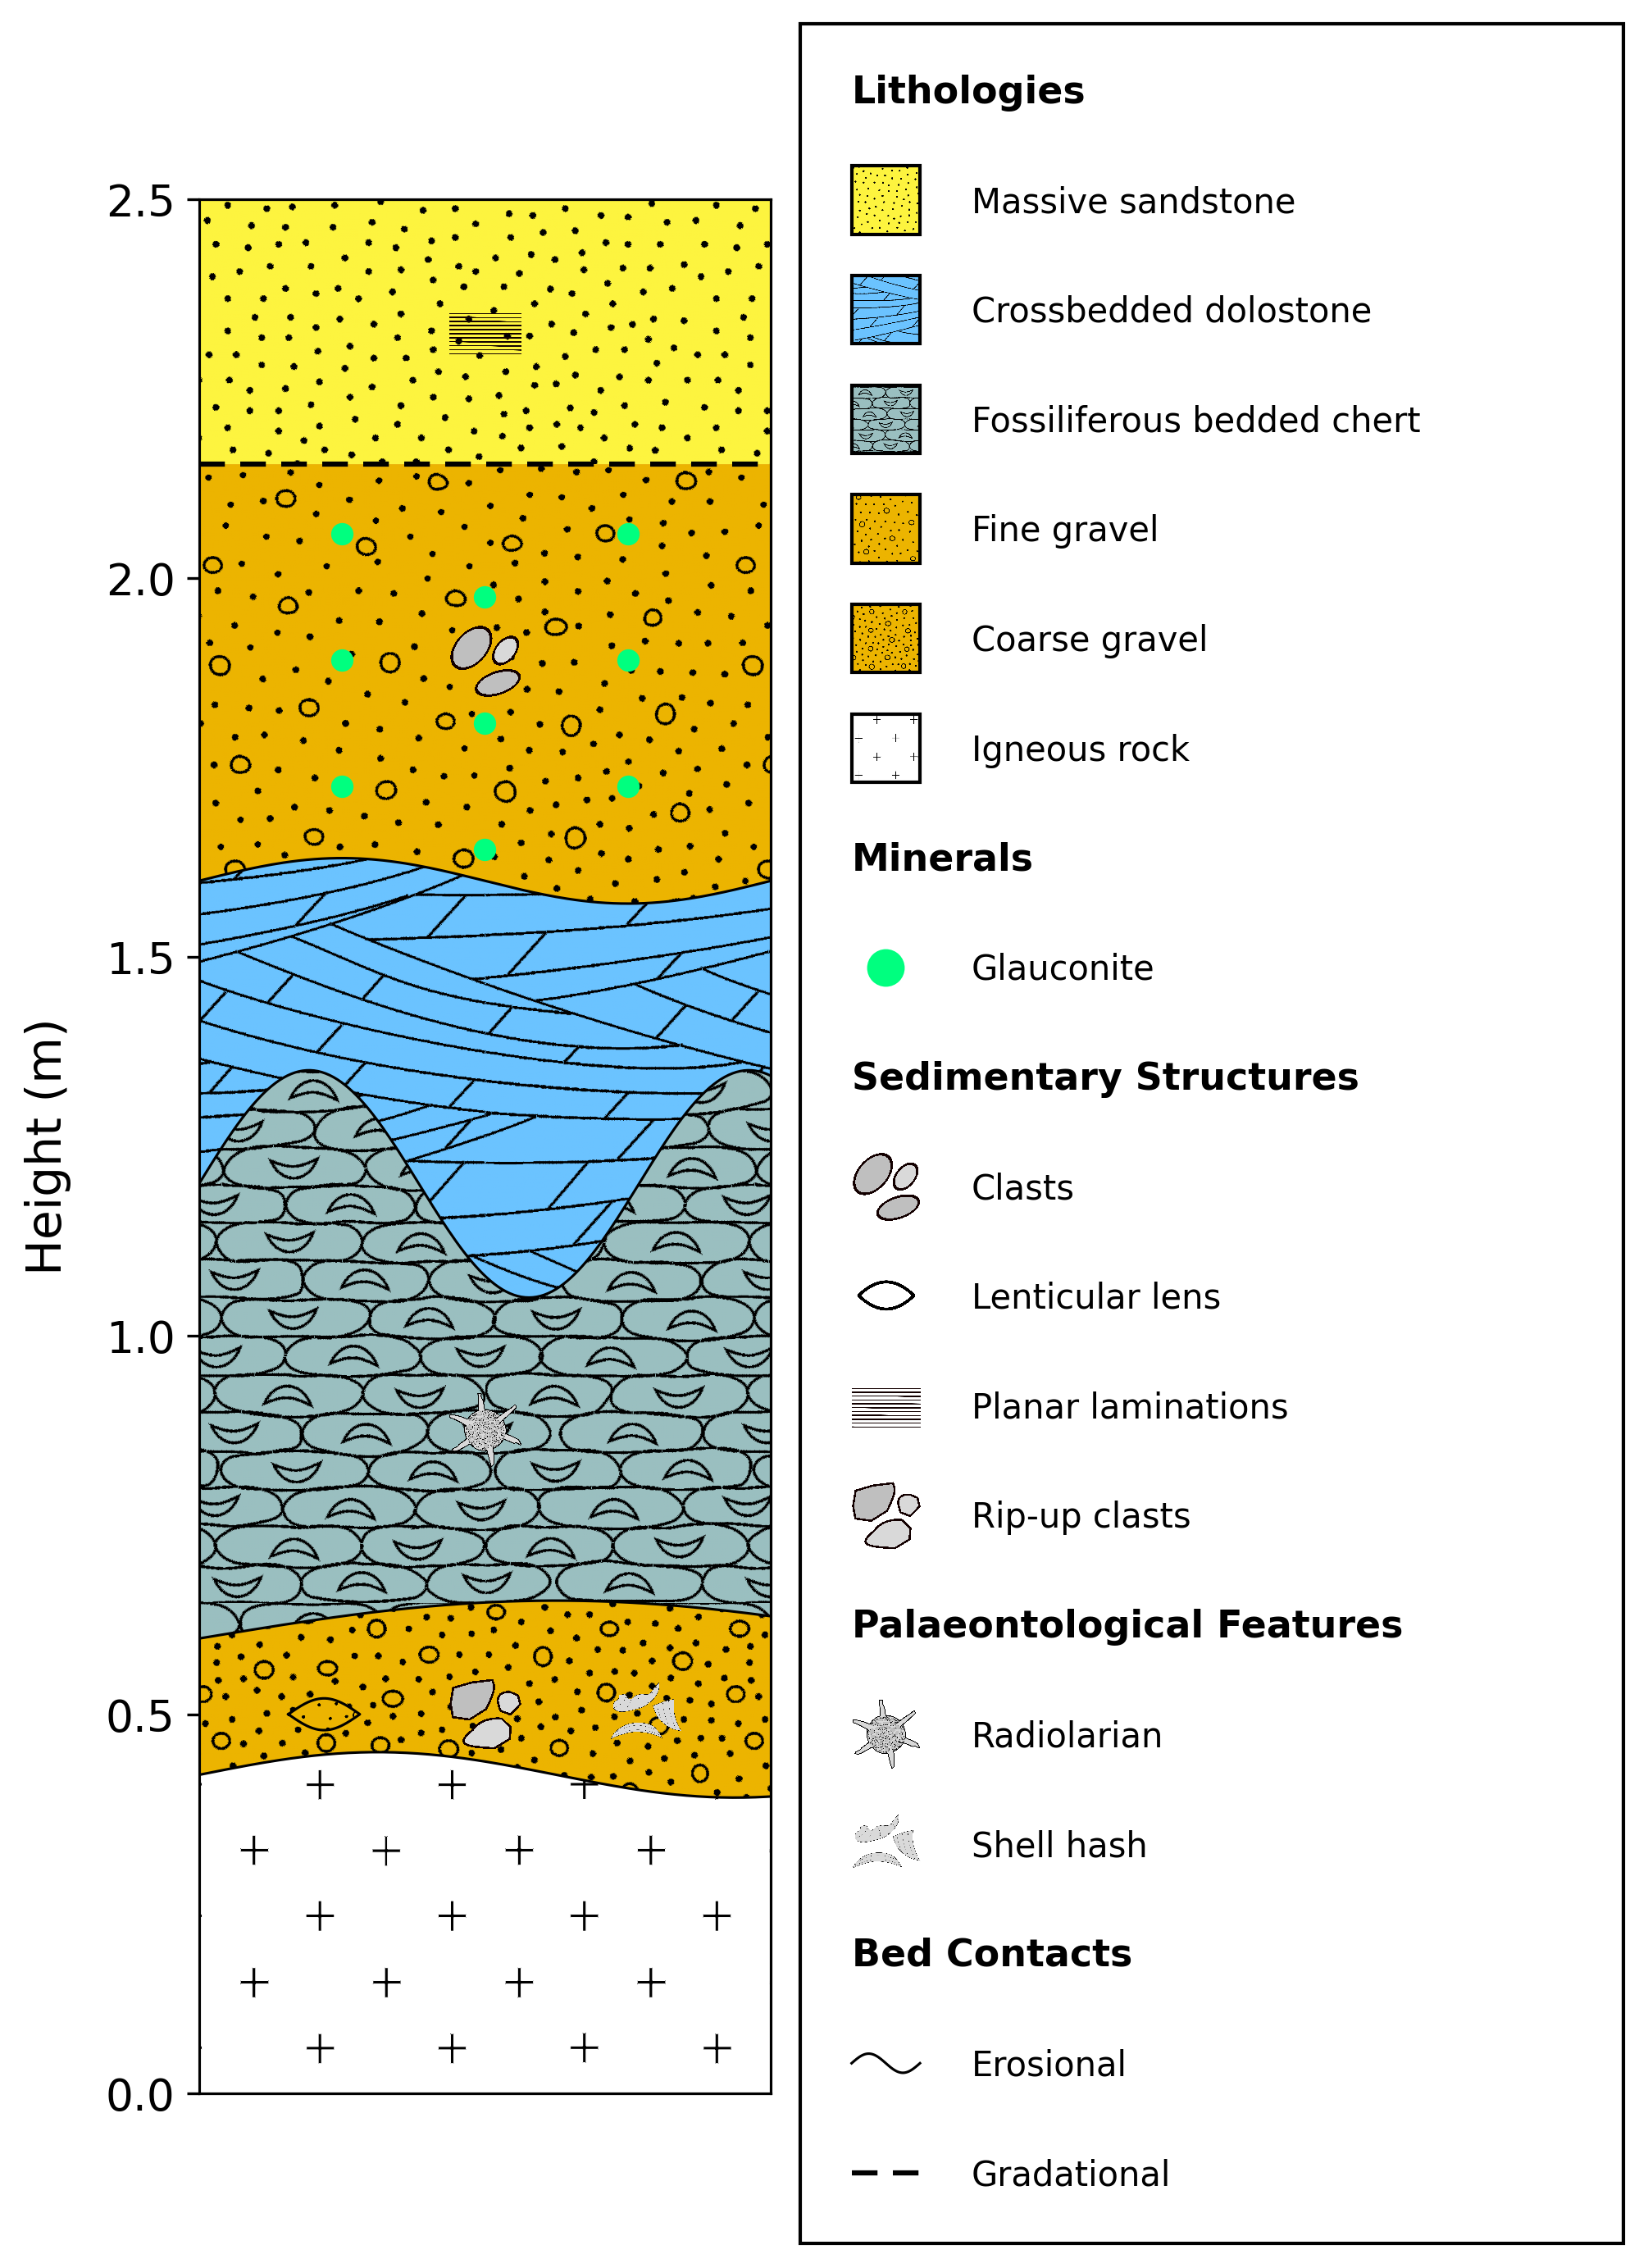
Log mode is a simple log layout without a grain size x-axis, and units are filled with lithological patterns.
import stratapy as sp
log = sp.load('examples.tutorial.csv')

# Log layout (no grain size x-axis, filled units)
log.plot(display_mode='log')
To switch between these layouts, the optional keyword argument display_mode can be passed to LogObject.plot(), with accepted values being 'default', 'grainsize', or 'log'. For example, the code below illustrates how each of the three figures in the tabs above can be created. Once the LogObject has been loaded using sp.load(), the .plot() method can be called with the desired parameters, and can be done so multiple times to generate different log layouts from the same data:
import stratapy as sp
log = sp.load('examples.tutorial.csv')

# Default layout (grain size x-axis, filled units)
log.plot(display_mode='default')

# Grainsize layout (grain size x-axis, lithology column)
log.plot(display_mode='grainsize')

# Log layout (no grain size x-axis, filled units)
log.plot(display_mode='log')
log.save() can be added after each .plot() call to save each figure, if desired.