Twin Y Axis
If a second y-axis is desired, perhaps to show a different reference scale or offset to a different scale/datum, this can be added using the .add_twin_axis() method which creates a second y-axis on the left side of the log, with a specified offset.
Usage
Provide a list of strings which match the number of units in your log, and these will be added as labels next to the units on the y-axis. For example:
import stratapy as sp
log = sp.load('examples.age_based_log_Ka.csv')
log.plot()
log.add_labels(
    labels = ["a","b","c","d"],
)
Parameters
offset (float, optional): The offset of the twin y-axis range from the main y-axis range, in units of the y-axis. Default is 0 (i.e., the same range as the main y-axis).
limits (tuple, optional): Instead of
offset, a specific range of y-values can be set for the twin axis using the limits parameter, which takes a tuple of (min, max) values. If both offset and limits are provided, limits will take precedence.label (str, optional): A label for the twin y-axis, which will be displayed next to the axis. Default is an empty string (no label).
spacing (float, optional): The spacing between the twin y-axis and the main y-axis, in points. Default is 80.
Examples
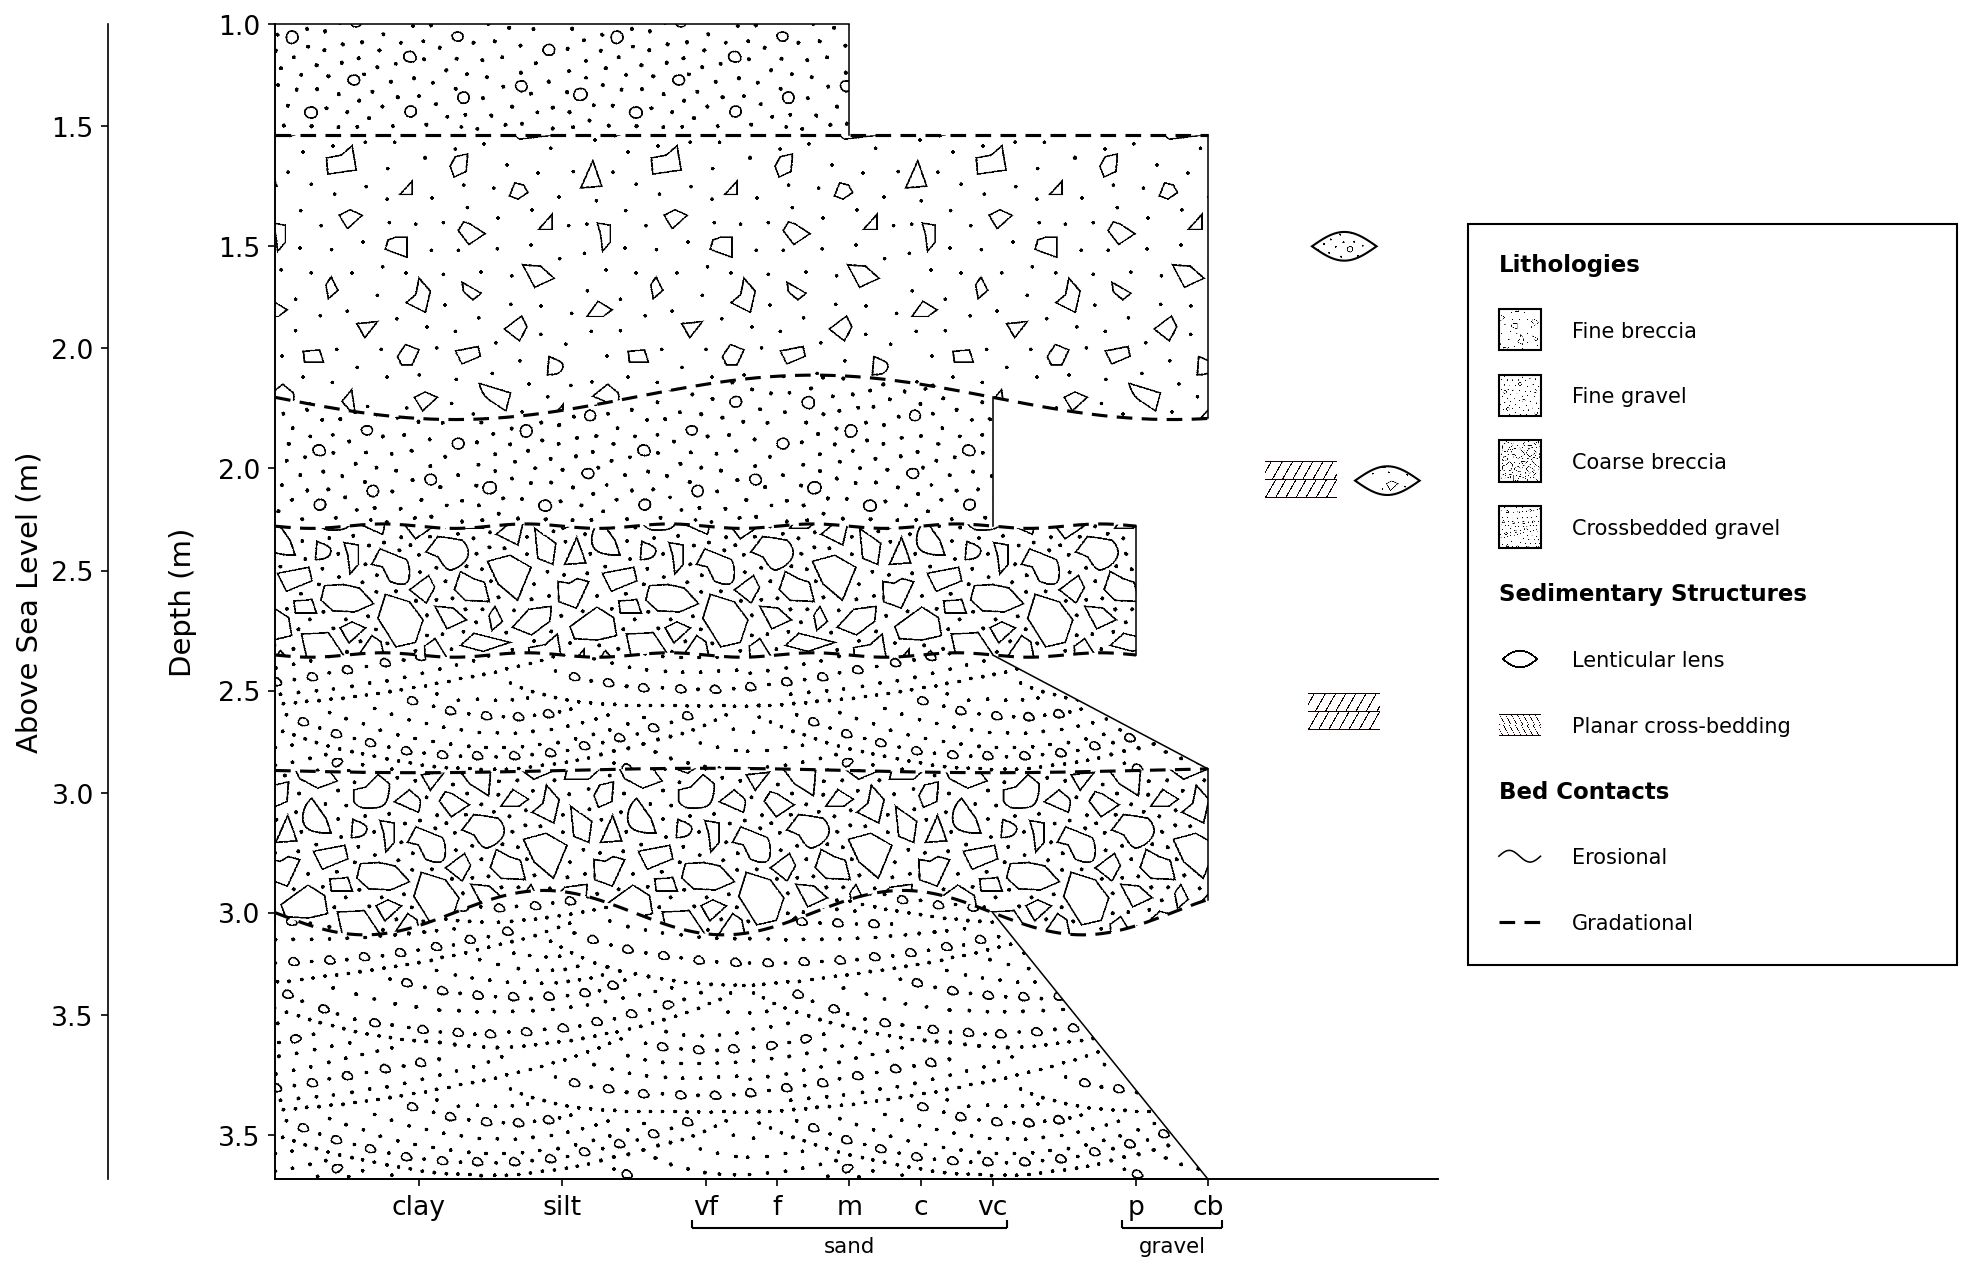
# Load a log
log = sp.load('./examples.sedimentary_log.csv')
# Plot the log
log.plot()
# Add a twin y-axis with an offset of 0.27 (e.g., to show height above sea level instead of depth)
log.add_twin_axis(0.27, label='Above Sea Level (m)')
See Also
API Reference for
stratapy.core.LogObject.add_twin_axis()