Sample Locations
Often, we want to highlight points along a log where sample, photographs, or other data were collected. This can be done using the .add_samples() method, which accepts a list of y-axis values where markers should be placed.
Each time this function is called, it will add a new set of markers to the log and the legend, if a label is specified. This enables you to add multiple sets of samples with different styles and labels.
The x-position of the points can also be customised using the x parameter, and any matplotlib marker style arguments can be passed to scatter_kwargs to change the appearance of the markers.
Usage
After you have created and plotted a log, simply call the add_chronostratigraphy method on your LogObject instance:
import stratapy as sp
log = sp.load('examples.sedimentary_log.csv')
log.plot()
log.add_samples(
    samples = [1.35, 2.2, 2.9, 3.19],
    label = 'Photographs',
    scatter_kwargs={'color': 'red', 's': 50, 'marker': 'o'}
)
Parameters
samples (list): A list of y-values at which to place sample markers.
label (str, optional): A label for this set of sample markers, which will be added to the legend. Default is None (no label).
x (float, optional): The x-position at which to place the sample markers. Default is -0.25 (to the left of the log).
scatter_kwargs (dict, optional): A dictionary of keyword arguments to pass to matplotlib.pyplot.scatter for styling the markers (e.g., colour, marker style, size). Default is an empty dictionary (no custom styling).
Requirements and Behaviour
The y-values provided in the samples list should be within the range of the log’s y-axis for the markers to be visible.
Examples
# Load the log
log = sp.load('examples.sedimentary_log.csv')
# Plot the log
log.plot(figsize=(6, 10), dpi=300)
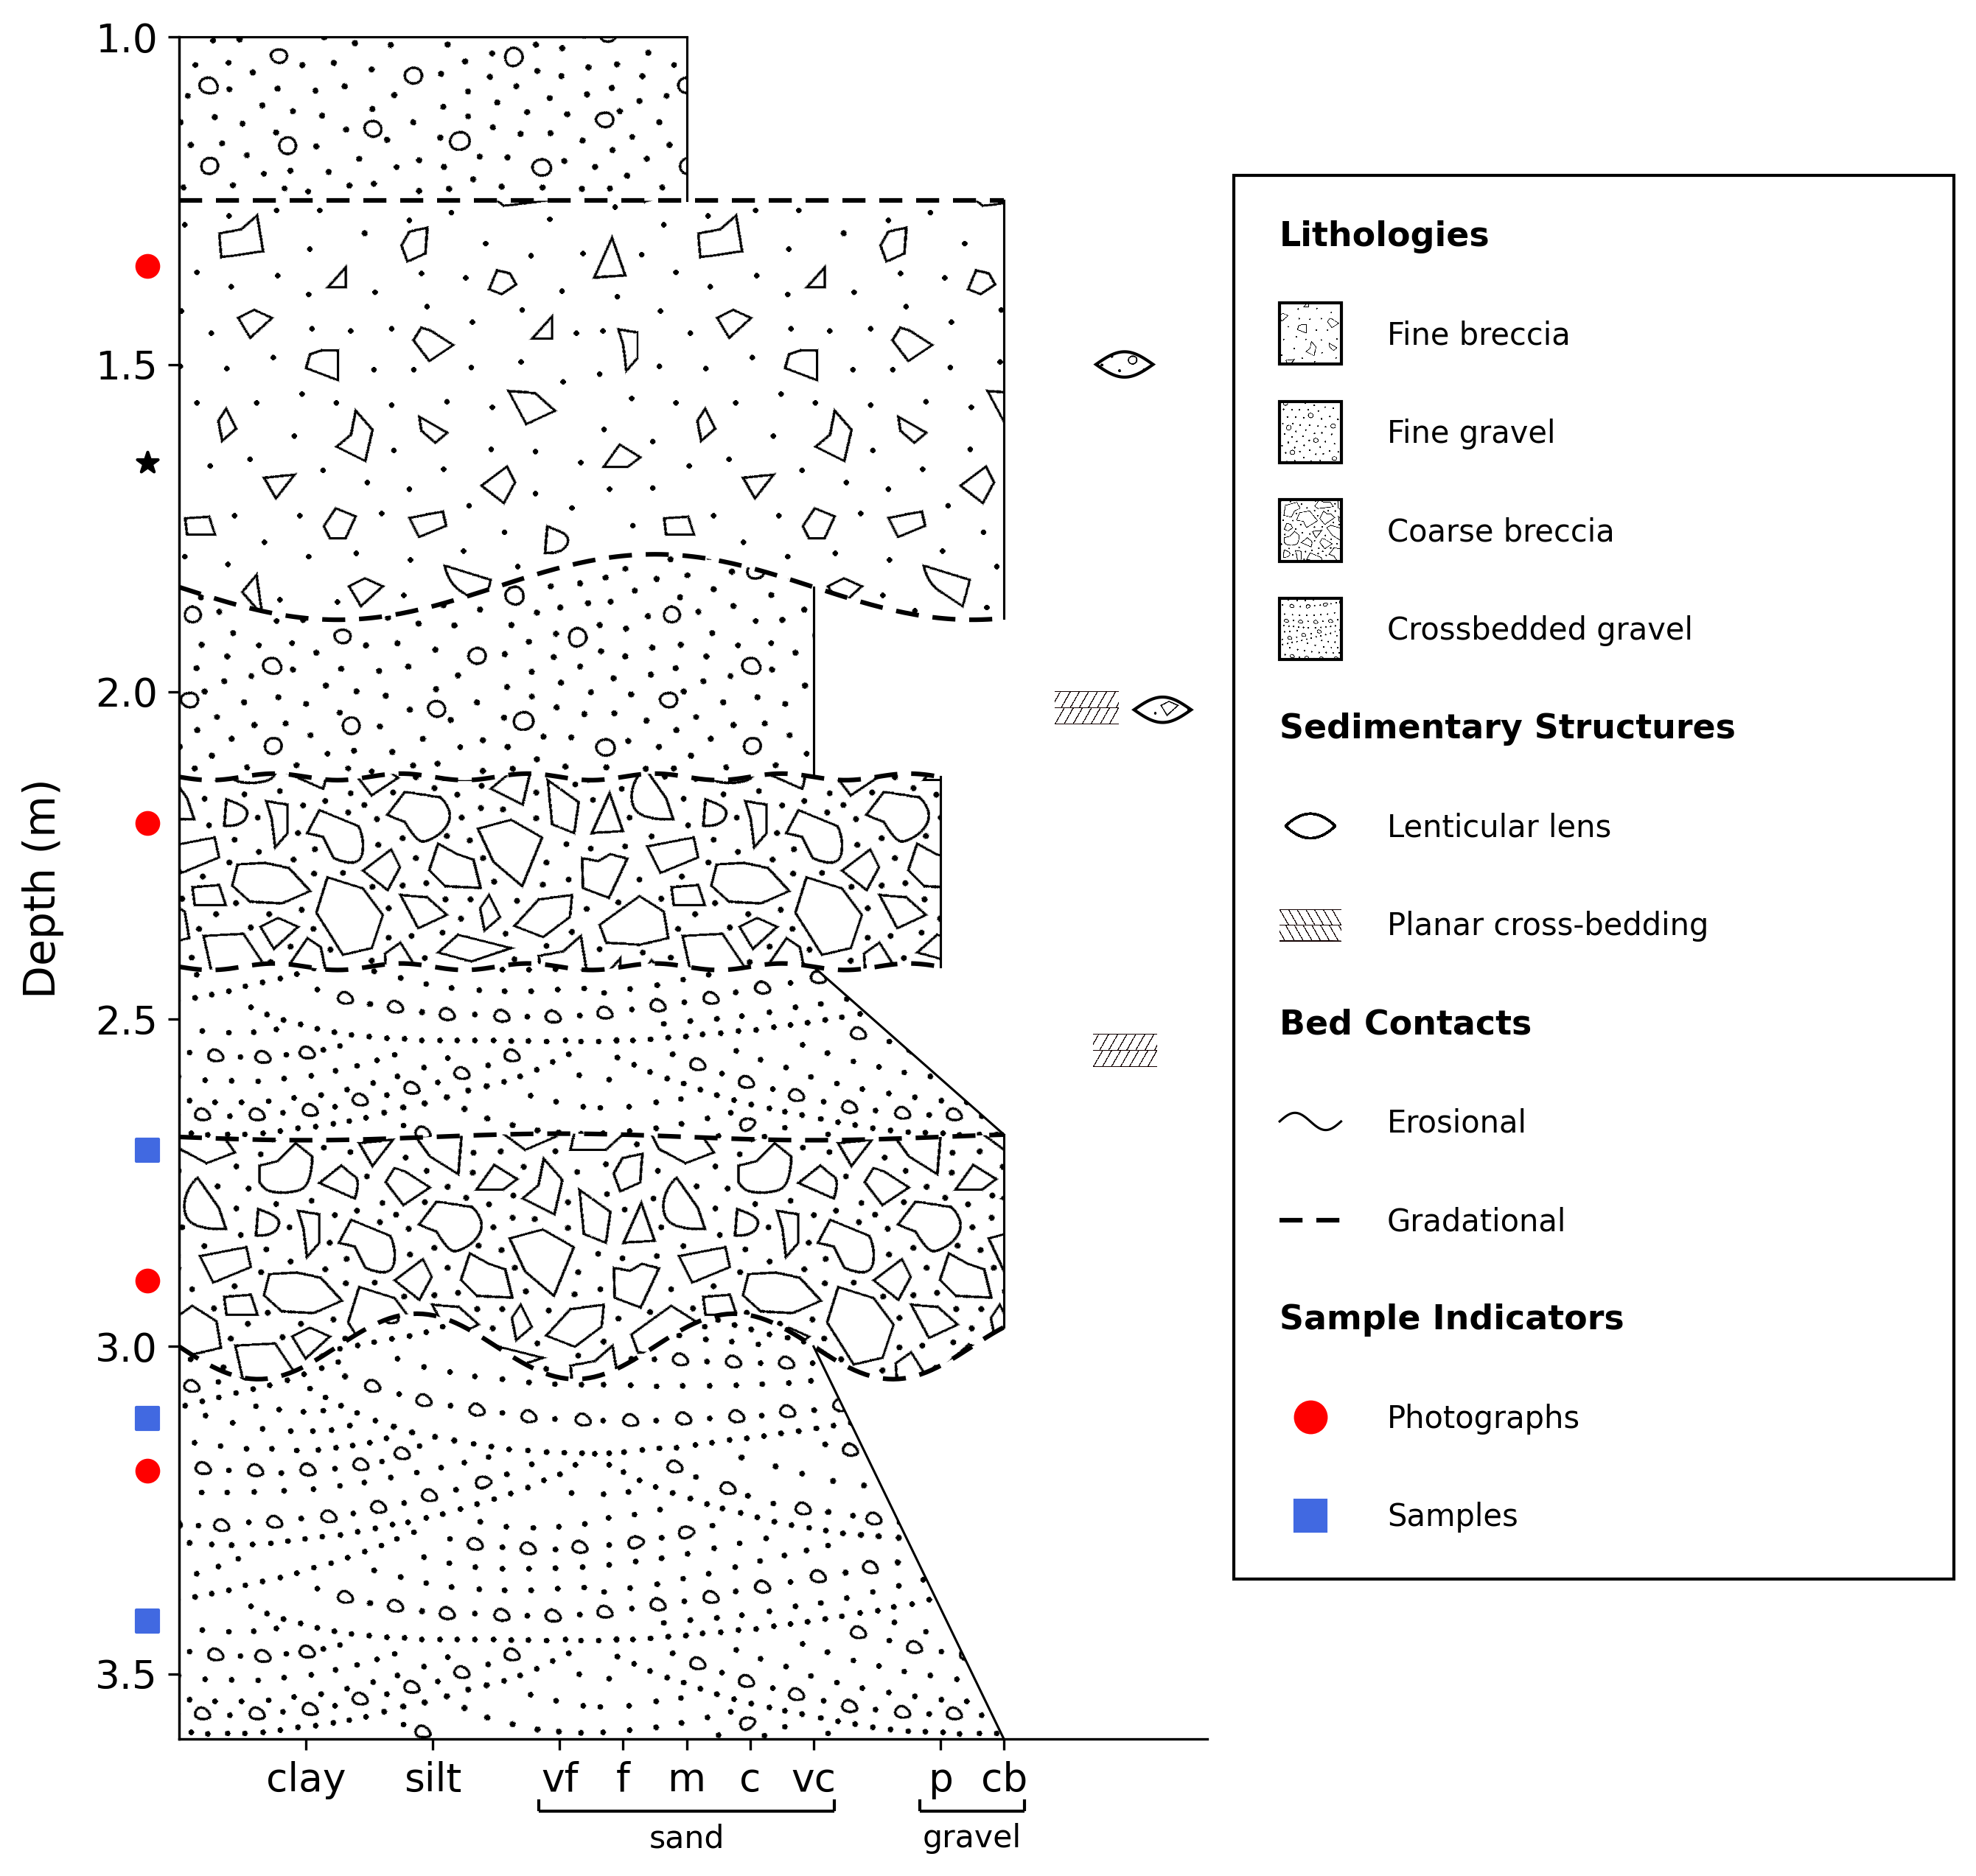
# Add one suite of sample markers for photographs
log.add_samples([1.35, 2.2, 2.9, 3.19], label='Photographs', scatter_kwargs={'color': 'red', 's': 50, 'marker': 'o'})
# Add another e.g., for geochemical samples
log.add_samples([2.7, 3.11, 3.42], label='Samples', scatter_kwargs={'color': 'royalblue', 's': 50, 'marker': 's'})
# A single sample with no label, perhaps to be referenced in the text
log.add_samples([1.65], scatter_kwargs={'color': 'k', 's': 50, 'marker': '*'})
See Also
API Reference for
stratapy.core.LogObject.add_samples()